WeightWatchers 2015 Annual Report Download - page 64
Download and view the complete annual report
Please find page 64 of the 2015 WeightWatchers annual report below. You can navigate through the pages in the report by either clicking on the pages listed below, or by using the keyword search tool below to find specific information within the annual report.-
 1
1 -
2
-
3
-
4
-
5
-
6
-
7
-
8
-
9
-
10
-
11
-
12
-
13
-
14
-
15
-
16
-
17
-
18
-
19
-
20
-
21
-
22
-
23
-
24
-
25
-
26
-
27
-
28
-
29
-
30
-
31
-
32
-
33
-
34
-
35
-
36
-
37
-
38
-
39
-
40
-
41
-
42
-
43
-
44
-
45
-
46
-
47
-
48
-
49
-
50
-
51
-
52
-
53
-
 54
54 -
 55
55 -
 56
56 -
 57
57 -
 58
58 -
 59
59 -
 60
60 -
 61
61 -
 62
62 -
 63
63 -
 64
64 -
 65
65 -
 66
66 -
 67
67 -
 68
68 -
 69
69 -
 70
70 -
 71
71 -
 72
72 -
 73
73 -
 74
74 -
75
-
76
-
77
-
78
-
79
-
80
-
81
-
82
-
83
-
84
-
85
-
86
-
87
-
88
-
89
-
90
-
91
-
92
-
93
-
94
-
95
-
96
-
97
-
98
-
99
-
100
-
101
-
102
-
103
-
104
-
105
-
106
-
107
-
108
-
109
-
110
-
111
-
112
-
113
-
114
-
115
-
116
-
117
-
118
-
119
-
120
-
121
-
122
-
123
-
124
-
125
-
126
-
127
-
128
-
129
-
130
-
131
-
132
-
133
-
134
-
135
-
136
-
137
-
138
-
139
-
140
-
141
-
142
-
143
-
144
-
145
-
146
-
147
-
148
-
149
-
150
-
151
-
152
-
153
-
154
-
155
-
156
-
157
-
158
-
159
 |
 |

Excluding the changes in cash and cash equivalents and current portion of long-term debt at both dates, the
working capital deficit at January 2, 2016 decreased by $54.2 million to $172.3 million from $226.5 million at
January 3, 2015. The factors contributing to this decrease in our working capital deficit were: (i) a $31.6 million
decrease in other operational liabilities arising from lower accrued liabilities and accounts payable balances
versus year-end fiscal 2014 primarily driven by reduced marketing spend and a decline in technology
transformation spend, (ii) a $17.7 million decrease in accrued salaries and wages driven by lower headcount and
a lower bonus payment, (iii) a $7.7 million increase in prepaid income taxes, (iv) a $8.7 million increase in other
current assets driven by a tax withholding receivable in Germany, (v) a $4.6 million decrease in deferred revenue
driven by a decline in business performance and (vi) a $2.2 million decline in accrued interest. These factors
were partially offset by: (i) a $4.5 million decrease in inventory, (ii) a $1.7 million increase in the derivative
payable, (iii) a $2.7 million decrease in receivable and (iv) a $9.4 million decrease in income taxes in fiscal 2015.
Cash Flows
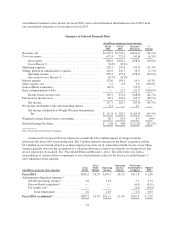
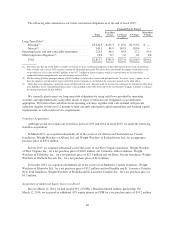
The following table sets forth a summary of the Company’s cash flows for the fiscal years ended:
January 2,
2016
January 3,
2015
December 28,
2013
(in millions)
Net cash provided by operating activities ........ $54.8 $231.6 $ 323.5
Net cash used in investing activities ............ $(40.3) $ (69.0) $(145.3)
Net cash used in financing activities ............ $(68.6) $ (29.4) $ (74.4)
Operating Activities
Fiscal 2015
Cash flows provided by operating activities of $54.8 million for fiscal 2015 reflected a decrease of
$176.8 million from $231.6 million of cash flows provided by operating activities for fiscal 2014. The decrease
in cash provided by operating activities was primarily the result of $84.9 million of lower net income attributable
to the Company in fiscal 2015 as compared to the prior year and the year-over-year working capital deficit
decrease of $84.1 million.
Fiscal 2014
Cash flows provided by operating activities of $231.6 million for fiscal 2014 decreased by $91.9 million
from $323.5 million of cash flows provided by operating activities for fiscal 2013. The decrease in cash provided
by operating activities was primarily the result of $85.0 million of lower net income attributable to the Company
in fiscal 2014 as compared to the prior year.
Fiscal 2013
Cash flows provided by operating activities of $323.5 million for fiscal 2013 decreased by $13.2 million
from $336.7 million in fiscal 2012. The decrease in cash provided by operating activities was primarily the result
of lower net income in fiscal 2013 as compared to the prior year offset by the add back of the non-cash early
extinguishment of debt charge and the intangible and long-lived asset impairment charges in fiscal 2013 as well
as a payment to HMRC in fiscal 2012 in connection with the previously reported UK self-employment liability.
61