WeightWatchers 2015 Annual Report Download - page 44
Download and view the complete annual report
Please find page 44 of the 2015 WeightWatchers annual report below. You can navigate through the pages in the report by either clicking on the pages listed below, or by using the keyword search tool below to find specific information within the annual report.-
 1
1 -
2
-
3
-
4
-
5
-
6
-
7
-
8
-
9
-
10
-
11
-
12
-
13
-
14
-
15
-
16
-
17
-
18
-
19
-
20
-
21
-
22
-
23
-
24
-
25
-
26
-
27
-
28
-
29
-
30
-
31
-
32
-
33
-
 34
34 -
 35
35 -
 36
36 -
 37
37 -
 38
38 -
 39
39 -
 40
40 -
 41
41 -
 42
42 -
 43
43 -
 44
44 -
 45
45 -
 46
46 -
 47
47 -
 48
48 -
 49
49 -
 50
50 -
 51
51 -
 52
52 -
 53
53 -
 54
54 -
55
-
56
-
57
-
58
-
59
-
60
-
61
-
62
-
63
-
64
-
65
-
66
-
67
-
68
-
69
-
70
-
71
-
72
-
73
-
74
-
75
-
76
-
77
-
78
-
79
-
80
-
81
-
82
-
83
-
84
-
85
-
86
-
87
-
88
-
89
-
90
-
91
-
92
-
93
-
94
-
95
-
96
-
97
-
98
-
99
-
100
-
101
-
102
-
103
-
104
-
105
-
106
-
107
-
108
-
109
-
110
-
111
-
112
-
113
-
114
-
115
-
116
-
117
-
118
-
119
-
120
-
121
-
122
-
123
-
124
-
125
-
126
-
127
-
128
-
129
-
130
-
131
-
132
-
133
-
134
-
135
-
136
-
137
-
138
-
139
-
140
-
141
-
142
-
143
-
144
-
145
-
146
-
147
-
148
-
149
-
150
-
151
-
152
-
153
-
154
-
155
-
156
-
157
-
158
-
159
 |
 |
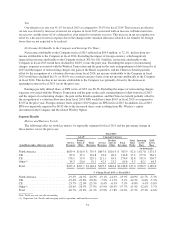
United Kingdom Metrics and Business Trends
In fiscal 2013, UK Total Paid Weeks declined 13.6% driven by a decline in Meeting Paid Weeks of 19.2%
and a decline in Online Paid Weeks of 2.8% versus the prior year. The decline in Meeting Paid Weeks in fiscal
2013 was driven by the lower Incoming Active Meeting Subscribers at the beginning of fiscal 2013 versus the
beginning of fiscal 2012 coupled with lower meeting recruitments in the year as compared to the prior year. In
fiscal 2013, local competition in the United Kingdom significantly contributed to the decline in meeting
recruitments.
In fiscal 2014, UK Total Paid Weeks declined 9.2% versus the prior year, driven by a decline in Meeting
Paid Weeks of 9.6% and a decline in Online Paid Weeks of 8.6% versus the prior year. Total Paid Weeks
performance in fiscal 2014 was driven by the lower Incoming Active Base at the beginning of fiscal 2014 versus
the beginning of fiscal 2013 coupled with lower recruitments in fiscal 2014 as compared to the prior year. In
response to weakening recruitment trends, early in fiscal 2014, the United Kingdom introduced new advertising,
implemented new promotional tactics and invested in a local marketing campaign to combat a strong local
competitor. As a result of these initiatives, the recruitment trend turned positive in the second half of fiscal 2014
as compared to the prior year period.
In fiscal 2015, UK Total Paid Weeks declined 14.3% versus the prior year, driven by a decline in
Meeting Paid Weeks of 13.2% and a decline in Online Paid Weeks of 16.1% versus the prior year. Total Paid
Weeks performance in fiscal 2015 was driven by the lower Incoming Active Base at the beginning of fiscal
2015 versus the beginning of fiscal 2014 coupled with lower recruitments in fiscal 2015 as compared to the
prior year. Although recruitments in fiscal 2015 remained lower year-over-year, the year-over-year
recruitment trend in the second, third and fourth quarters of fiscal 2015 in the United Kingdom improved as
compared to the first quarter of fiscal 2015 driven by the use of new promotional tactics and the new program
launch in early December 2015.
Continental Europe Metrics and Business Trends
In fiscal 2013, Continental Europe Total Paid Weeks increased 19.9%, driven primarily by an increase in
Online Paid Weeks, up 38.4%, versus the prior year. Continental Europe benefitted from an increased number of
Incoming Active Meeting Subscribers at the beginning of fiscal 2013 versus the beginning of fiscal 2012, which
was partially offset by lower recruitments in fiscal 2013 versus the prior year.
In fiscal 2014, Continental Europe Total Paid Weeks increased 3.1% driven by an increase in Online Paid
Weeks of 6.5%, partially offset by a decline in Meeting Paid Weeks of 2.5%, versus the prior year. This increase
in Online Paid Weeks was driven by the higher number of Incoming Active Online Subscribers at the start of
fiscal 2014 versus the start of fiscal 2013. The decrease in Meeting Paid Weeks was driver by a lower number of
Incoming Active Meeting Subscribers at the start of fiscal 2014 versus the start of fiscal 2013 and recruitment
declines. Although Total Paid Weeks continued to grow in fiscal 2014, it reflected a significant slowdown in the
year-over-year trend.
In fiscal 2015, Continental Europe Total Paid Weeks declined 8.0% versus the prior year, driven by a
decline in Meeting Paid Weeks of 9.8% and a decline in Online Paid Weeks of 6.9% versus the prior year. This
decline in Meeting Paid Weeks was driven by the lower number of Incoming Active Meeting Subscribers at the
start of fiscal 2015 versus the start of fiscal 2014 coupled with lower meeting recruitments in fiscal 2015 as
compared to the prior year. Although the number of Incoming Active Online Subscribers at the start of fiscal
2015 was higher than at the start of fiscal 2014, recruitment softness in the year led to this decline in Online Paid
Weeks compared to the prior year. Although recruitments in fiscal 2015 remained lower year-over-year, the year-
over-year recruitment trend in the second, third and fourth quarters of fiscal 2015 in Continental Europe
improved as compared to the first quarter of fiscal 2015 driven by the use of new promotional tactics and the new
program launch in early December 2015.
41