WeightWatchers 2015 Annual Report Download - page 51
Download and view the complete annual report
Please find page 51 of the 2015 WeightWatchers annual report below. You can navigate through the pages in the report by either clicking on the pages listed below, or by using the keyword search tool below to find specific information within the annual report.-
 1
1 -
2
-
3
-
4
-
5
-
6
-
7
-
8
-
9
-
10
-
11
-
12
-
13
-
14
-
15
-
16
-
17
-
18
-
19
-
20
-
21
-
22
-
23
-
24
-
25
-
26
-
27
-
28
-
29
-
30
-
31
-
32
-
33
-
34
-
35
-
36
-
37
-
38
-
39
-
40
-
 41
41 -
 42
42 -
 43
43 -
 44
44 -
 45
45 -
 46
46 -
 47
47 -
 48
48 -
 49
49 -
 50
50 -
 51
51 -
 52
52 -
 53
53 -
 54
54 -
 55
55 -
 56
56 -
 57
57 -
 58
58 -
 59
59 -
 60
60 -
 61
61 -
62
-
63
-
64
-
65
-
66
-
67
-
68
-
69
-
70
-
71
-
72
-
73
-
74
-
75
-
76
-
77
-
78
-
79
-
80
-
81
-
82
-
83
-
84
-
85
-
86
-
87
-
88
-
89
-
90
-
91
-
92
-
93
-
94
-
95
-
96
-
97
-
98
-
99
-
100
-
101
-
102
-
103
-
104
-
105
-
106
-
107
-
108
-
109
-
110
-
111
-
112
-
113
-
114
-
115
-
116
-
117
-
118
-
119
-
120
-
121
-
122
-
123
-
124
-
125
-
126
-
127
-
128
-
129
-
130
-
131
-
132
-
133
-
134
-
135
-
136
-
137
-
138
-
139
-
140
-
141
-
142
-
143
-
144
-
145
-
146
-
147
-
148
-
149
-
150
-
151
-
152
-
153
-
154
-
155
-
156
-
157
-
158
-
159
 |
 |

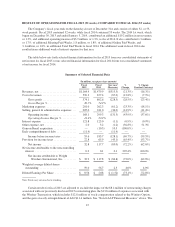
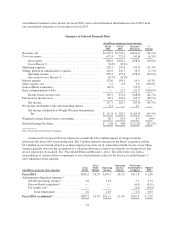
table below sets forth a reconciliation of certain of those components of our selected financial data for the fiscal
year ended January 2, 2016 which have been adjusted.
(in millions, except per share amounts)
Gross
Profit
Gross
Profit
Margin
Operating
Income
Operating
Income
Margin
Net Income
Attributable to
Company
Diluted
EPS
Fiscal 2015 ............................. $574.1 49.3% $168.1 14.4% $32.9 $ 0.56
Adjustments to Reported Amounts(1)
2015 Restructuring charges(1) ........... 1.5 8.4 5.1 0.09
Winfrey Transaction Expenses(1) ........ — 13.6 8.3 0.14
Early extinguishment of debt(1) .......... — — (7.0) (0.12)
Total Adjustments ................ 1.5 22.0 6.5 0.1
Fiscal 2015, as adjusted(1) ................. $575.6 49.4% $190.1 16.3% $39.4 $ 0.67
Note: Totals may not sum due to rounding
(1) “As adjusted” is a non-GAAP financial measure that adjusts the consolidated statements of net income for fiscal 2015 to exclude the
impact of the $8.4 million ($5.1 million after tax) of restructuring charges associated with our previously disclosed 2015 restructuring
plan, the $13.6 million ($8.3 million after tax) of expenses associated with the Winfrey Transaction, which includes $12.8 million of
stock compensation related to the Winfrey Option, and the gain on early extinguishment of debt of $11.4 million ($7.0 million after tax).
See “Non-GAAP Financials Measures” above for an explanation of our use of non-GAAP financial measures.
Certain results for fiscal 2014 are adjusted to exclude the $11.8 million impact of charges from the
previously disclosed 2014 restructuring plan, $10.5 million related to the gain on the Brazil acquisition and the
$2.4 million net tax benefit related to an intercompany loan write-off in connection with the closure of our China
business partially offset by the recognition of a valuation allowance related to tax benefits for foreign losses that
are not expected to be realized. See “Non-GAAP Financial Measures” above. The table below sets forth a
reconciliation of certain of those components of our selected financial data for the fiscal year ended January 3,
2015 which have been adjusted.
(in millions, except per share amounts)
Gross
Profit
Gross
Profit
Margin
Operating
Income
Operating
Income
Margin
Net Income
Attributable to
Company
Diluted
EPS
Fiscal 2014 ............................. $802.6 54.2% $299.3 20.2% $117.8 $ 2.08
Adjustments to Reported Amounts(1)
2014 Restructuring charges(1) ........... 4.6 11.8 7.2 0.13
Gain on Brazil acquisition(1) ............ — — (6.4) (0.11)
Tax benefit, net(1) .................... — — (2.4) (0.04)
Total Adjustments ................ 4.6 11.8 (1.5) 0.03
Fiscal 2014, as adjusted(1) ................. $807.2 54.5% $311.1 21.0% $116.3 $ 2.05
Note: Totals may not sum due to rounding
(1) As adjusted” is a non-GAAP financial measure that adjusts the consolidated statements of net income for fiscal 2014 to exclude the
impact of the $11.8 million ($7.2 million after tax) of restructuring charges associated with our previously disclosed 2014 restructuring
plan, the gain of $10.5 million ($6.4 million after tax) recognized in connection with our previously disclosed Brazil acquisition due to an
adjustment to our previously held equity interest to fair value offset by a charge associated with the settlement of the royalty-free
arrangement of the Brazilian partnership and the impact of the $2.4 million net tax benefit associated with an intercompany loan write-
off in connection with the closure of our China business partially offset by the recognition of a valuation allowance related to tax benefits
for foreign losses that are not expected to be realized. See “Non-GAAP Financials Measures” above for an explanation of our use of non-
GAAP financial measures.
Consolidated Results
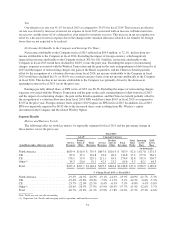
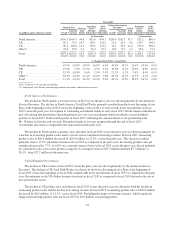
Revenues
Revenues in fiscal 2015 declined by 21.3% versus fiscal 2014 driven by revenue declines in the meetings
and Online businesses globally, particularly in North America. Excluding the impact of foreign currency, which
48