WeightWatchers 2015 Annual Report Download - page 108
Download and view the complete annual report
Please find page 108 of the 2015 WeightWatchers annual report below. You can navigate through the pages in the report by either clicking on the pages listed below, or by using the keyword search tool below to find specific information within the annual report.-
 1
1 -
2
-
3
-
4
-
5
-
6
-
7
-
8
-
9
-
10
-
11
-
12
-
13
-
14
-
15
-
16
-
17
-
18
-
19
-
20
-
21
-
22
-
23
-
24
-
25
-
26
-
27
-
28
-
29
-
30
-
31
-
32
-
33
-
34
-
35
-
36
-
37
-
38
-
39
-
40
-
41
-
42
-
43
-
44
-
45
-
46
-
47
-
48
-
49
-
50
-
51
-
52
-
53
-
54
-
55
-
56
-
57
-
58
-
59
-
60
-
61
-
62
-
63
-
64
-
65
-
66
-
67
-
68
-
69
-
70
-
71
-
72
-
73
-
74
-
75
-
76
-
77
-
78
-
79
-
80
-
81
-
82
-
83
-
84
-
85
-
86
-
87
-
88
-
89
-
90
-
91
-
92
-
93
-
94
-
95
-
96
-
97
-
 98
98 -
 99
99 -
 100
100 -
 101
101 -
 102
102 -
 103
103 -
 104
104 -
 105
105 -
 106
106 -
 107
107 -
 108
108 -
 109
109 -
 110
110 -
 111
111 -
 112
112 -
 113
113 -
 114
114 -
 115
115 -
 116
116 -
 117
117 -
 118
118 -
119
-
120
-
121
-
122
-
123
-
124
-
125
-
126
-
127
-
128
-
129
-
130
-
131
-
132
-
133
-
134
-
135
-
136
-
137
-
138
-
139
-
140
-
141
-
142
-
143
-
144
-
145
-
146
-
147
-
148
-
149
-
150
-
151
-
152
-
153
-
154
-
155
-
156
-
157
-
158
-
159
 |
 |

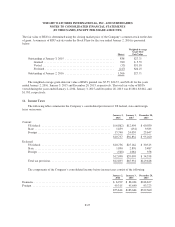
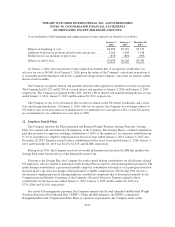
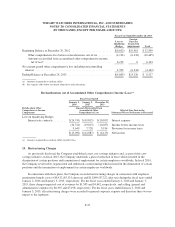
WEIGHT WATCHERS INTERNATIONAL, INC. AND SUBSIDIARIES
NOTES TO CONSOLIDATED FINANCIAL STATEMENTS
(IN THOUSANDS, EXCEPT PER SHARE AMOUNTS)
Depreciation and Amortization for the Year Ended
January 2,
2016
January 3,
2015
December 28,
2013
North America .......................................... $47,128 $34,654 $35,928
United Kingdom ........................................ 766 1,158 1,269
Continental Europe ...................................... 1,861 2,356 2,222
Other ................................................. 1,473 2,144 1,965
Total segment depreciation and amortization .................. 51,228 40,312 41,384
General corporate depreciation and amortization ............... 8,829 18,227 14,197
Depreciation and amortization ............................. $60,057 $58,539 $55,581
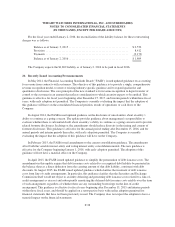
The following tables present information about the Company’s sources of revenue and other information by
geographic area. There were no material amounts of sales or transfers among geographic areas and no material
amounts of US export sales.
Revenues for the Year Ended
January 2,
2016
January 3,
2015
December 28,
2013
Meeting Fees ............................................... $ 587,801 $ 744,560 $ 851,626
Online Subscription Revenues ................................. 349,567 437,385 509,135
In-meeting product sales ...................................... 127,291 169,101 211,963
Licensing, franchise royalties and other .......................... 99,760 128,870 151,399
$1,164,419 $1,479,916 $1,724,123
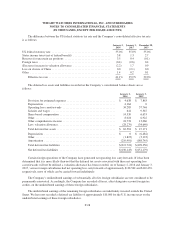
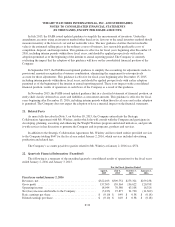
Revenues for the Year Ended
January 2,
2016
January 3,
2015
December 28,
2013
United States ............................................... $ 700,972 $ 869,541 $1,067,200
Canada ................................................... 54,277 78,175 95,802
United Kingdom ............................................ 124,773 156,843 172,783
Continental Europe .......................................... 229,147 298,878 299,403
Other ..................................................... 55,250 76,479 88,935
$1,164,419 $1,479,916 $1,724,123
Long-Lived Assets
January 2,
2016
January 3,
2015
December 28,
2013
United States .................................................. $51,103 $67,903 $79,448
Canada ....................................................... 2,757 3,149 3,070
United Kingdom ............................................... 2,938 724 1,192
Continental Europe ............................................. 614 1,454 2,083
Other ........................................................ 774 1,420 1,259
$58,186 $74,650 $87,052
F-33