WeightWatchers 2015 Annual Report Download - page 55
Download and view the complete annual report
Please find page 55 of the 2015 WeightWatchers annual report below. You can navigate through the pages in the report by either clicking on the pages listed below, or by using the keyword search tool below to find specific information within the annual report.-
 1
1 -
2
-
3
-
4
-
5
-
6
-
7
-
8
-
9
-
10
-
11
-
12
-
13
-
14
-
15
-
16
-
17
-
18
-
19
-
20
-
21
-
22
-
23
-
24
-
25
-
26
-
27
-
28
-
29
-
30
-
31
-
32
-
33
-
34
-
35
-
36
-
37
-
38
-
39
-
40
-
41
-
42
-
43
-
44
-
 45
45 -
 46
46 -
 47
47 -
 48
48 -
 49
49 -
 50
50 -
 51
51 -
 52
52 -
 53
53 -
 54
54 -
 55
55 -
 56
56 -
 57
57 -
 58
58 -
 59
59 -
 60
60 -
 61
61 -
 62
62 -
 63
63 -
 64
64 -
 65
65 -
66
-
67
-
68
-
69
-
70
-
71
-
72
-
73
-
74
-
75
-
76
-
77
-
78
-
79
-
80
-
81
-
82
-
83
-
84
-
85
-
86
-
87
-
88
-
89
-
90
-
91
-
92
-
93
-
94
-
95
-
96
-
97
-
98
-
99
-
100
-
101
-
102
-
103
-
104
-
105
-
106
-
107
-
108
-
109
-
110
-
111
-
112
-
113
-
114
-
115
-
116
-
117
-
118
-
119
-
120
-
121
-
122
-
123
-
124
-
125
-
126
-
127
-
128
-
129
-
130
-
131
-
132
-
133
-
134
-
135
-
136
-
137
-
138
-
139
-
140
-
141
-
142
-
143
-
144
-
145
-
146
-
147
-
148
-
149
-
150
-
151
-
152
-
153
-
154
-
155
-
156
-
157
-
158
-
159
 |
 |

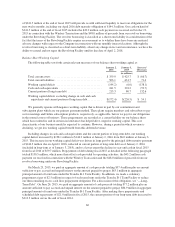
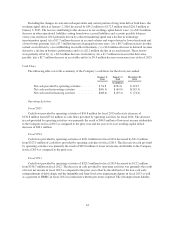
Fiscal 2015
Meeting Fees Meeting
Paid
Weeks
Incoming
Active
Meeting
Subscribers
EOP
Active
Meeting
Subscribers
Online Subscription
Revenues Online
Paid
Weeks
Incoming
Active
Online
Subscribers
EOP
Active
Online
Subscribers(in millions unless otherwise stated) GAAP
Constant
Currency GAAP
Constant
Currency
(in thousands) (in thousands)
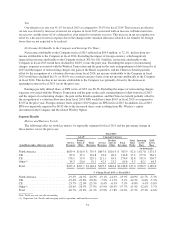
North America ..................$399.5 $404.3 40.8 692.6 645.1 $239.9 $242.7 51.7 925.2 886.4
UK ........................... 65.1 70.3 10.7 158.1 153.2 22.4 24.2 6.6 119.7 109.9
CE ........................... 99.4 118.6 11.6 178.2 172.4 76.7 92.5 21.2 373.6 358.3
Other(1) ........................ 23.8 29.8 2.4 26.4 27.2 10.5 12.7 1.9 35.6 37.2
Total ..........................$587.8 $623.1 65.5 1,055.4 997.9 $349.6 $372.1 81.4 1,454.1 1,391.8
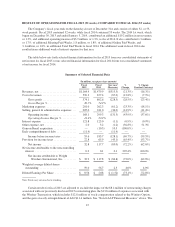
% Change Fiscal 2015 vs. Fiscal 2014
North America ................ -19.5% -19.0% -18.9% -16.9% -6.9% -19.6% -19.2% -22.6% -25.0% -4.2%
UK ......................... -19.4% -7.9% -13.5% -4.7% -3.1% -19.5% -8.1% -15.9% -8.9% -8.2%
CE ......................... -25.5% -10.8% -9.6% -2.9% -3.3% -21.2% -5.2% -7.0% 8.4% -4.1%
Other(1) ...................... -30.3% -16.2% -11.4% -22.0% 2.8% -24.3% -15.1% -11.5% -4.1% 4.4%
Total ........................ -21.1% -16.3% -16.2% -13.3% -5.4% -20.1% -15.2% -18.3% -16.7% -4.3%
Note: Totals may not sum due to rounding
(1) Represents Asia Pacific and emerging markets operations and franchise revenues.
North America Performance
The decline in North America revenues in fiscal 2015 versus the prior year was driven primarily by the decline in
Service Revenues. The decline in North America Total Paid Weeks primarily resulted from the lower Incoming Active
Base at the beginning of fiscal 2015 versus the beginning of fiscal 2014 as well as from lower recruitments in fiscal
2015 versus the prior year. In response to weakening recruitment trends in early fiscal 2015, North America introduced
new advertising and promotions which benefitted year-over-year recruitment trends in both the second and third
quarters of fiscal 2015. In the fourth quarter of fiscal 2015, following the announcement of our partnership with
Ms. Winfrey in October and our early December launch of our new program through the end of fiscal 2015,
recruitments increased as compared to the same period in the prior year.
The decline in North America product sales and other in fiscal 2015 versus the prior year was driven primarily by
a decline in in-meeting product sales and to a lesser extent a decline in licensing revenue. In fiscal 2015, in-meeting
product sales of $64.8 million decreased by $20.4 million, or 23.9%, versus the prior year. This decrease resulted
primarily from a 17.5% attendance decline in fiscal 2015 as compared to the prior year. In-meeting product sales per
attendee decreased by 7.7%, or 6.8% on a constant currency basis, in fiscal 2015 versus the prior year, driven primarily
by a decline in sales across most product categories. Licensing revenue of $27.5 million declined $9.7 million, or
26.1%, from $37.2 million in the prior year.
United Kingdom Performance
The decline in UK revenues in fiscal 2015 versus the prior year was driven primarily by the decline in Service
Revenues. The decline in UK Total Paid Weeks was driven by the lower Incoming Active Base at the beginning of
fiscal 2015 versus the beginning of fiscal 2014 coupled with lower recruitments in fiscal 2015 as compared to the prior
year. Recruitments in the UK Online business increased in fiscal 2015 as compared to fiscal 2014 driven by the use of
new promotional tactics.
The decline in UK product sales and other in fiscal 2015 versus the prior year was driven by both the decline in
in-meeting product sales and the decline in licensing revenue. In fiscal 2015, in-meeting product sales of $23.8 million
decreased by $6.4 million, or 21.1%, versus fiscal 2014. Excluding the impact of foreign currency, which negatively
impacted in-meeting product sales for fiscal 2015 by $2.0 million, in-meeting product
52