WeightWatchers 2015 Annual Report Download - page 33
Download and view the complete annual report
Please find page 33 of the 2015 WeightWatchers annual report below. You can navigate through the pages in the report by either clicking on the pages listed below, or by using the keyword search tool below to find specific information within the annual report.-
 1
1 -
2
-
3
-
4
-
5
-
6
-
7
-
8
-
9
-
10
-
11
-
12
-
13
-
14
-
15
-
16
-
17
-
18
-
19
-
20
-
21
-
22
-
 23
23 -
 24
24 -
 25
25 -
 26
26 -
 27
27 -
 28
28 -
 29
29 -
 30
30 -
 31
31 -
 32
32 -
 33
33 -
 34
34 -
 35
35 -
 36
36 -
 37
37 -
 38
38 -
 39
39 -
 40
40 -
 41
41 -
 42
42 -
 43
43 -
44
-
45
-
46
-
47
-
48
-
49
-
50
-
51
-
52
-
53
-
54
-
55
-
56
-
57
-
58
-
59
-
60
-
61
-
62
-
63
-
64
-
65
-
66
-
67
-
68
-
69
-
70
-
71
-
72
-
73
-
74
-
75
-
76
-
77
-
78
-
79
-
80
-
81
-
82
-
83
-
84
-
85
-
86
-
87
-
88
-
89
-
90
-
91
-
92
-
93
-
94
-
95
-
96
-
97
-
98
-
99
-
100
-
101
-
102
-
103
-
104
-
105
-
106
-
107
-
108
-
109
-
110
-
111
-
112
-
113
-
114
-
115
-
116
-
117
-
118
-
119
-
120
-
121
-
122
-
123
-
124
-
125
-
126
-
127
-
128
-
129
-
130
-
131
-
132
-
133
-
134
-
135
-
136
-
137
-
138
-
139
-
140
-
141
-
142
-
143
-
144
-
145
-
146
-
147
-
148
-
149
-
150
-
151
-
152
-
153
-
154
-
155
-
156
-
157
-
158
-
159
 |
 |

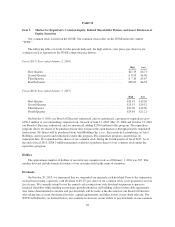
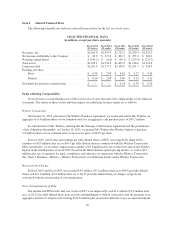
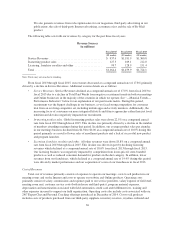
Item 6. Selected Financial Data
The following schedule sets forth our selected financial data for the last five fiscal years.
SELECTED FINANCIAL DATA
(in millions, except per share amounts)
Fiscal 2015
(52 weeks)
Fiscal 2014
(53 weeks)
Fiscal 2013
(52 weeks)
Fiscal 2012
(52 weeks)
Fiscal 2011
(52 weeks)
Revenues, net ................................ $1,164.4 $1,479.9 $1,724.1 $1,839.4 $1,832.5
Net income attributable to the Company ........... $ 32.9 $ 117.8 $ 202.7 $ 257.4 $ 304.9
Working capital deficit ........................ $ (144.2) $ (6.0) $ (30.1) $ (229.9) $ (279.7)
Total assets ................................. $1,422.1 $1,534.6 $1,405.9 $1,218.6 $1,121.6
Long-term debt .............................. $2,021.3 $2,277.3 $2,358.0 $2,291.7 $ 926.9
Earnings per share:
Basic .................................. $ 0.56 $ 2.08 $ 3.61 $ 4.27 $ 4.16
Diluted ................................. $ 0.56 $ 2.08 $ 3.60 $ 4.23 $ 4.11
Dividends declared per common share ............ $ — $ — $ 0.53 $ 0.70 $ 0.70
Items Affecting Comparability
Several events occurred during each of the last five fiscal years that affect the comparability of our financial
statements. The nature of these events and their impact on underlying business trends are as follows:
Winfrey Transaction
On October 19, 2015, pursuant to the Winfrey Purchase Agreement, we issued and sold to Ms. Winfrey an
aggregate of 6.4 million shares of our common stock for an aggregate cash purchase price of $43.2 million.
In consideration of Ms. Winfrey entering into the Strategic Collaboration Agreement and the performance
of her obligations thereunder, on October 18, 2015, we granted Ms. Winfrey the Winfrey Option to purchase
3.5 million shares of our common stock at an exercise price of $6.97 per share.
In fiscal 2015, net income and earnings per fully diluted share, or EPS, were negatively impacted by
expenses of $8.3 million after tax or $0.14 per fully diluted share in connection with the Winfrey Transaction.
More specifically, we recorded compensation expense of $7.8 million after tax for the full value of the Winfrey
Option in the fourth quarter of fiscal 2015 (based on the Black Scholes option pricing model), as well as $0.5
million after tax of expenses for legal, compliance and other fees in connection with the Winfrey Transaction.
See “Item 1. Business—History—Winfrey Transaction” for additional details on the Winfrey Transaction.
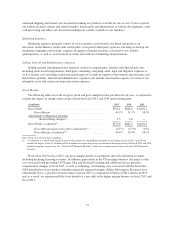
Restructuring Charges
In fiscal 2015 and fiscal 2014, we recorded $8.4 million ($5.1 million after tax or $0.09 per fully diluted
share) and $11.8 million ($7.2 million after tax or $0.13 per fully diluted share) of charges, respectively,
associated with the restructuring of our organization.
Early Extinguishment of Debt
Net income and EPS for the full year of fiscal 2015 were impacted by an $11.4 million ($7.0 million after
tax), or $0.12 per fully diluted share, gain on early extinguishment of debt in connection with the payment of an
aggregate amount of cash proceeds totaling $134.6 million plus an amount sufficient to pay accrued and unpaid
30