Volvo 2008 Annual Report Download - page 98
Download and view the complete annual report
Please find page 98 of the 2008 Volvo annual report below. You can navigate through the pages in the report by either clicking on the pages listed below, or by using the keyword search tool below to find specific information within the annual report.-
 1
1 -
2
-
3
-
4
-
5
-
6
-
7
-
8
-
9
-
10
-
11
-
12
-
13
-
14
-
15
-
16
-
17
-
18
-
19
-
20
-
21
-
22
-
23
-
24
-
25
-
26
-
27
-
28
-
29
-
30
-
31
-
32
-
33
-
34
-
35
-
36
-
37
-
38
-
39
-
40
-
41
-
42
-
43
-
44
-
45
-
46
-
47
-
48
-
49
-
50
-
51
-
52
-
53
-
54
-
55
-
56
-
57
-
58
-
59
-
60
-
61
-
62
-
63
-
64
-
65
-
66
-
67
-
68
-
69
-
70
-
71
-
72
-
73
-
74
-
75
-
76
-
77
-
78
-
79
-
80
-
81
-
82
-
83
-
84
-
85
-
86
-
87
-
 88
88 -
 89
89 -
 90
90 -
 91
91 -
 92
92 -
 93
93 -
 94
94 -
 95
95 -
 96
96 -
 97
97 -
 98
98 -
 99
99 -
 100
100 -
 101
101 -
 102
102 -
 103
103 -
 104
104 -
 105
105 -
 106
106 -
 107
107 -
 108
108 -
109
-
110
-
111
-
112
-
113
-
114
-
115
-
116
-
117
-
118
-
119
-
120
-
121
-
122
-
123
-
124
-
125
-
126
-
127
-
128
-
129
-
130
-
131
-
132
-
133
-
134
-
135
-
136
-
137
-
138
-
139
-
140
-
141
-
142
-
143
-
144
-
145
-
146
-
147
-
148
-
149
-
150
-
151
-
152
-
153
-
154
-
155
-
156
-
157
-
158
-
159
-
160
 |
 |
Notes to consolidated fi nancial statements
94
THE VOLVO GROUP
Financial information 2008
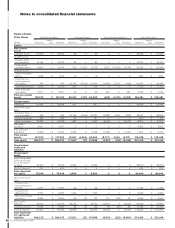
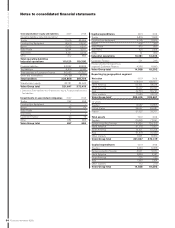
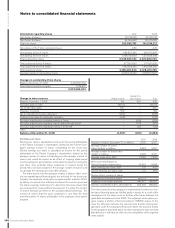
Total shareholders’ equity and liabilities 2007 2008
Operating liabilities, Industrial operations:1
Trucks 77,975 85,366
Construction Equipment 18,310 18,137
Buses 6,072 6,531
Volvo Penta 3,254 3,517
Volvo Aero 4,137 4,975
Other 372 869
Total operating liabilities
Industrial operations 110,120 119,395
Financial liabilities 48,032 58,426
Tax liabilities 8,519 8,242
Total liabilities in Customer Finance 86,953 107,927
Other and eliminations (14,758) (6,211)
Total liabilities 238,866 287,779
Shareholders’ equity 82,781 84,640
Volvo Group total 321,647 372,419
1 Defi ned as Total liabilities less Shareholders’ equity, Financial liabilities and
Tax liabilities.
Investments in associated companies 2007 2008
Trucks 292 266
Construction Equipment ––
Buses 55 64
Volvo Penta ––
Volvo Aero 11
Customer Finance 25 18
Other 284 303
Volvo Group total 657 652
Capital expenditures 2007 2008
Trucks 5,816 7,998
Construction Equipment 2,795 2,503
Buses 405 386
Volvo Penta 510 656
Volvo Aero 824 1,304
Other 31 359
Industrial operations 10,381 13,206
Customer Finance 291 246
Reclassifi cation Group versus
segment Customer Finance 4,266 4,840
Volvo Group total 14,938 18,292
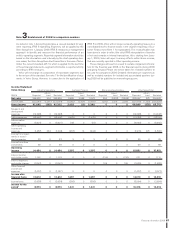
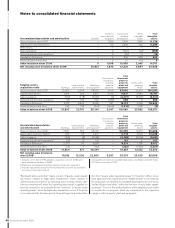
Reporting by geographical segment
Net sales 2007 2008
Europe 158,019 158,857
North America 50,651 48,514
South America 16,237 20,301
Asia 42,513 55,797
Other markets 17,985 20,198
Volvo Group total* 285,405 303,667
*of which:
Sweden 13,987 13,855
United States 39,697 36,681
France 31,327 33,707
Total assets 2007 2008
Sweden 76,832 77,591
Europe excluding Sweden 110,806 129,325
North America 61,218 71,007
South America 13,521 15,704
Asia 51,879 70,439
Other markets 7,391 8,353
Volvo Group total 321,647 372,419
Capital expenditures 2007 2008
Sweden 3,444 5,358
Europe excluding Sweden 6,991 9,071
North America 2,806 2,147
South America 220 182
Asia 1,365 1,264
Other markets 112 270
Volvo Group total 14,938 18,292