Volvo 2008 Annual Report Download - page 46
Download and view the complete annual report
Please find page 46 of the 2008 Volvo annual report below. You can navigate through the pages in the report by either clicking on the pages listed below, or by using the keyword search tool below to find specific information within the annual report.-
 1
1 -
2
-
3
-
4
-
5
-
6
-
7
-
8
-
9
-
10
-
11
-
12
-
13
-
14
-
15
-
16
-
17
-
18
-
19
-
20
-
21
-
22
-
23
-
24
-
25
-
26
-
27
-
28
-
29
-
30
-
31
-
32
-
33
-
34
-
35
-
 36
36 -
 37
37 -
 38
38 -
 39
39 -
 40
40 -
 41
41 -
 42
42 -
 43
43 -
 44
44 -
 45
45 -
 46
46 -
 47
47 -
 48
48 -
 49
49 -
 50
50 -
 51
51 -
 52
52 -
 53
53 -
 54
54 -
 55
55 -
 56
56 -
57
-
58
-
59
-
60
-
61
-
62
-
63
-
64
-
65
-
66
-
67
-
68
-
69
-
70
-
71
-
72
-
73
-
74
-
75
-
76
-
77
-
78
-
79
-
80
-
81
-
82
-
83
-
84
-
85
-
86
-
87
-
88
-
89
-
90
-
91
-
92
-
93
-
94
-
95
-
96
-
97
-
98
-
99
-
100
-
101
-
102
-
103
-
104
-
105
-
106
-
107
-
108
-
109
-
110
-
111
-
112
-
113
-
114
-
115
-
116
-
117
-
118
-
119
-
120
-
121
-
122
-
123
-
124
-
125
-
126
-
127
-
128
-
129
-
130
-
131
-
132
-
133
-
134
-
135
-
136
-
137
-
138
-
139
-
140
-
141
-
142
-
143
-
144
-
145
-
146
-
147
-
148
-
149
-
150
-
151
-
152
-
153
-
154
-
155
-
156
-
157
-
158
-
159
-
160
 |
 |
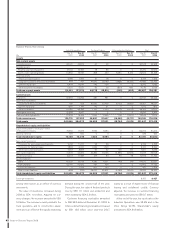
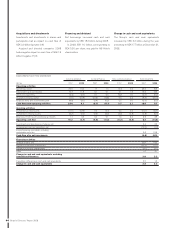
Balance Sheets Volvo Group
Industrial operations Customer Finance Elim. and reclassifi cations Total
Mkr
Dec 31
2007
Dec 31
2008
Dec 31
2007
Dec 31
2008
Dec 31
2007
Dec 31
2008
Dec 31
2007
Dec 31
2008
Assets
Non-current assets
Intangible assets 36,441 43,909 67 49 00 36,508 43,958
Tangible assets
Property, plant and equipment 47,132 57,185 78 86 00 47,210 57,270
Assets under operating leases 13,850 16,967 288 330 8,364 8,132 22,502 25,429
Financial assets
Shares and participation 2,189 1,935 30 18 00 2,219 1,953
Long-term customer-fi nancing receivables 444 467 47,870 59,189 (7,828) (9,224) 40,486 50,432
Deferred tax assets 8,434 10,976 346 204 30 8,783 11,180
Other long-term receivables 5,601 5,631 39 38 (861) 489 4,779 6,159
Total non-current assets 114,091 137,070 48,718 59,914 (322) (603) 162,487 196,381
Current assets
Inventories 43,264 54,084 381 961 00 43,645 55,045
Short-term receivables
Customer-fi nancing receivables 789 508 42,695 52,436 (5,123) (4,887) 38,361 48,057
Current tax assets 1,660 1,749 43 61 00 1,703 1,810
Other receivables 53,976 48,286 1,713 1,902 (11,272) (2,677) 44,417 47,512
Marketable securities 16,488 5,901 22 00 16,490 5,902
Cash and cash equivalents 13,538 16,674 1,053 2,245 (47) (1,207) 14,544 17,712
Total current assets 129,715 127,202 45,887 57,607 (16,442) (8,771) 159,160 176,038
Total assets 243,806 264,272 94,605 117,521 (16,764) (9,374) 321,647 372,419
Shareholders’ equity and liabilities
Equity attributable to the equity holders
of the parent company 74,550 74,416 7,652 9,594 00 82,202 84,010
Minority interests 579 630 00 00 579 630
Total shareholders’ equity 75,129 75,046 7,652 9,594 00 82,781 84,640
Non-current provisions
Provisions for post-employment benefi ts 9,746 11,677 28 28 00 9,774 11,705
Provisions for deferred taxes 7,868 6,557 1,259 1,703 00 9,127 8,260
Other non-current provisions 7,067 8,869 95 62 139 135 7,301 9,066
Non-current liabilities 41,339 43,062 42,285 53,155 (11,895) (3,609) 71,729 92,608
Current provisions 10,437 11,589 129 83 90 78 10,656 11,750
Current liabilities
Loans 40,539 56,178 4,382 6,501 (49) (48) 44,872 62,631
Trade payables 52,376 50,622 287 404 00 52,663 51,025
Current tax liabilities 0 1,044 451 160 00 451 1,204
Other current liabilities (695) (372) 38,037 45,831 (5,049) (5,930) 32,293 39,530
Total shareholders’ equity and liabilities 243,806 264,272 94,605 117,521 (16,764) (9,374) 321,647 372,419
Contingent liabilities 8,153 9,427
among other factors as an effect of currency
movements.
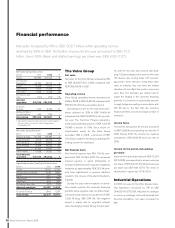
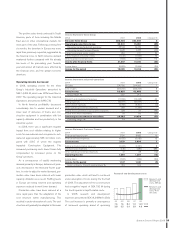
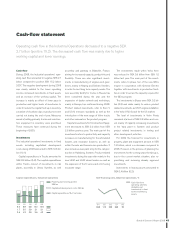
The value of inventories increased during
2008 by SEK 11.4 billion. Adjusted for cur-
rency changes, the increase amounted to SEK
5.8 billion. The increase is mainly related to the
truck operations and to construction equip-
ment and is an effect of the rapidly weakening
demand during the second half of the year.
During the year, the value of fi nished products
rose by SEK 11.1 billion and production and
other material by SEK 0.3 billion.
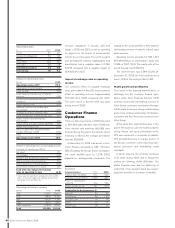
Customer fi nancing receivables amounted
to SEK 98.5 billion at December 31, 2008. In
total, customer fi nancing receivables increased
by SEK 19.6 billion since year-end 2007,
mainly as a result of higher levels of fi nancial
leasing and installment credits. Currency
adjusted, the increase in customer fi nancing
receivables amounted to SEK 9.7 billion.
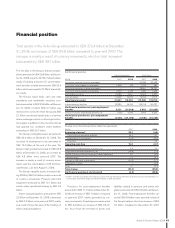
At the end of the year, the equity ratio in the
Industrial Operations was 28.4% and in the
Volvo Group 22.7%. Shareholder’s equity
amounted to SEK 84.6 billion.
42 Board of Directors’ Report 2008