Volvo 2008 Annual Report Download - page 45
Download and view the complete annual report
Please find page 45 of the 2008 Volvo annual report below. You can navigate through the pages in the report by either clicking on the pages listed below, or by using the keyword search tool below to find specific information within the annual report.-
 1
1 -
2
-
3
-
4
-
5
-
6
-
7
-
8
-
9
-
10
-
11
-
12
-
13
-
14
-
15
-
16
-
17
-
18
-
19
-
20
-
21
-
22
-
23
-
24
-
25
-
26
-
27
-
28
-
29
-
30
-
31
-
32
-
33
-
34
-
 35
35 -
 36
36 -
 37
37 -
 38
38 -
 39
39 -
 40
40 -
 41
41 -
 42
42 -
 43
43 -
 44
44 -
 45
45 -
 46
46 -
 47
47 -
 48
48 -
 49
49 -
 50
50 -
 51
51 -
 52
52 -
 53
53 -
 54
54 -
 55
55 -
56
-
57
-
58
-
59
-
60
-
61
-
62
-
63
-
64
-
65
-
66
-
67
-
68
-
69
-
70
-
71
-
72
-
73
-
74
-
75
-
76
-
77
-
78
-
79
-
80
-
81
-
82
-
83
-
84
-
85
-
86
-
87
-
88
-
89
-
90
-
91
-
92
-
93
-
94
-
95
-
96
-
97
-
98
-
99
-
100
-
101
-
102
-
103
-
104
-
105
-
106
-
107
-
108
-
109
-
110
-
111
-
112
-
113
-
114
-
115
-
116
-
117
-
118
-
119
-
120
-
121
-
122
-
123
-
124
-
125
-
126
-
127
-
128
-
129
-
130
-
131
-
132
-
133
-
134
-
135
-
136
-
137
-
138
-
139
-
140
-
141
-
142
-
143
-
144
-
145
-
146
-
147
-
148
-
149
-
150
-
151
-
152
-
153
-
154
-
155
-
156
-
157
-
158
-
159
-
160
 |
 |

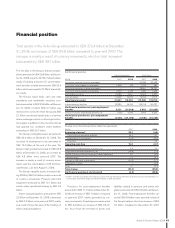
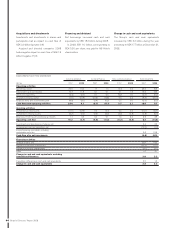
Financial position
Total assets in the Volvo Group amounted to SEK 372.4 billion at December
31, 2008, an increase of SEK 50.8 billion compared to year-end 2007. The
increase is mainly a result of currency movements, which in total increased
total assets by SEK 39.7 billion.
The net debt in the Group's Industrial Oper-
ations amounted to SEK 29.8 billion at Decem-
ber 31, 2008, equal to 39.7% of shareholders’
equity. Excluding provisions for post-employ-
ment benefi ts net debt amounted to SEK 20.5
billion, which was equal to 27.4% of sharehold-
ers’ equity.
The Group’s liquid funds, cash and cash
equivalents and marketable securities com-
bined, amounted to SEK 23.6 billion at Decem-
ber 31, 2008, of which SEK 0.7 billion was
restricted for use by the Volvo Group and SEK
2.7 billion constituted liquid funds in countries
where exchange controls or other legal restric-
tions apply. In addition to this, the Volvo Group
had granted but unutilized credit facilities
amounting to SEK 26.7 billion.
The Group’s intangible assets amounted to
SEK 43.9 billion at December 31, 2008. The
net value of development costs amounted to
SEK 12.4 billion at the end of the year. The
Group’s total goodwill amounted to SEK 24.8
billion at December 31, 2008, an increase by
SEK 4.8 billion since year-end 2007. The
increase is mainly a result of currency move-
ments and the consolidation of VE Commer-
cial Vehicles, Ltd. from August 1, 2008.
The Group’s tangible assets increased dur-
ing 2008 by SEK 13.0 billion, mainly as a result
of currency movements. Property, plant and
equip ment increased by SEK 10.1 billion and
assets under operational leasing by SEK 2.9
billion.
Shares and participations amounted to SEK
2.0 billion at December 31, 2008, a decrease
by SEK 0.2 billion since year-end 2007, mainly
as a result of lower fair value of the holdings of
shares and participations.
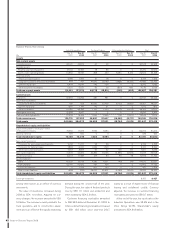
Net fi nancial position
Industrial operations Volvo Group
SEK M 2007 2008 2007 2008
Long-term customer-fi nance receivables –– 40,486 50,432
Long-term interest-bearing receivables 1,808 149 1,019 694
Short-term customer-fi nance receivables –– 38,361 48,057
Short-term interest-bearing receivables 9,773 3,476 1,380 1.965
Marketable securities 16,488 5,901 16,490 5,902
Cash and bank 13,538 16,674 14,544 17,712
Total fi nancial assets 41,607 26,200 112,280 124,762
Interest-bearing liabilities 38,286 46,749 108,318 145,727
Net fi nancial position excl. post employment
benefi ts 3,321 (20,549) 3,962 (20,965)
Provision for post employment benefi ts, net 7,626 9,246 7,643 9,263
Net fi nancial position incl. post employment
benefi ts (4,305) (29, 795) (3,681) (30,228)
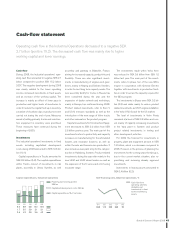
Change in net fi nancial position, Industrial operations
SEK bn 2007 2008
Beginning of period 1 23.1 (4.3)
Cash fl ow from operating activities 24.4 9.7
Investments in fi xed assets (10.3) (13.0)
Disposals 1.1 0.6
Operating cash-fl ow 15.2 (2.7)
Investments and divestments of shares, net 0.4 0.0
Acquired and divested operations, net (25.9) (1.3)
Capital injections to/from Customer Finance operations 2.1 (0.2)
Currency effect 1.0 (9.1)
Payment to AB Volvo shareholders (20.3) (11.1)
Revaluation of loans – (0.9)
Other 0.1 (0.2)
Total change (27.4) (25.5)
Net fi nancial position at end of period (4.3) (29.8)
1 2006 is restated according to new reporting structure for the Volvo Group. Net fi nancial position for Industrial Operations as
of December 31, 2006 changed from SEK 24.7 billion to SEK 23.1 billion.
Provisions for post-employment benefi ts
amounted to SEK 11.7 billion at December 31,
2008, an increase of SEK 1.9 billion compared
to year-end 2007, mainly generated by cur-
rency movements. Prepaid pensions amounted
to SEK 2.4 billion, an increase of SEK 0.3 bil-
lion. As a result, the net value of assets and
liabilities related to pensions and similar obli-
gations amounted to SEK 9.3 billion at Decem-
ber 31, 2008. Post-employment benefi ts val-
ued at SEK 9.8 billion were reported outside of
the Group’s balance sheet, an increase of SEK
7.2 billion compared to December 31, 2007,
41
Board of Directors’ Report 2008