Volvo 2008 Annual Report Download - page 91
Download and view the complete annual report
Please find page 91 of the 2008 Volvo annual report below. You can navigate through the pages in the report by either clicking on the pages listed below, or by using the keyword search tool below to find specific information within the annual report.-
 1
1 -
2
-
3
-
4
-
5
-
6
-
7
-
8
-
9
-
10
-
11
-
12
-
13
-
14
-
15
-
16
-
17
-
18
-
19
-
20
-
21
-
22
-
23
-
24
-
25
-
26
-
27
-
28
-
29
-
30
-
31
-
32
-
33
-
34
-
35
-
36
-
37
-
38
-
39
-
40
-
41
-
42
-
43
-
44
-
45
-
46
-
47
-
48
-
49
-
50
-
51
-
52
-
53
-
54
-
55
-
56
-
57
-
58
-
59
-
60
-
61
-
62
-
63
-
64
-
65
-
66
-
67
-
68
-
69
-
70
-
71
-
72
-
73
-
74
-
75
-
76
-
77
-
78
-
79
-
80
-
 81
81 -
 82
82 -
 83
83 -
 84
84 -
 85
85 -
 86
86 -
 87
87 -
 88
88 -
 89
89 -
 90
90 -
 91
91 -
 92
92 -
 93
93 -
 94
94 -
 95
95 -
 96
96 -
 97
97 -
 98
98 -
 99
99 -
 100
100 -
 101
101 -
102
-
103
-
104
-
105
-
106
-
107
-
108
-
109
-
110
-
111
-
112
-
113
-
114
-
115
-
116
-
117
-
118
-
119
-
120
-
121
-
122
-
123
-
124
-
125
-
126
-
127
-
128
-
129
-
130
-
131
-
132
-
133
-
134
-
135
-
136
-
137
-
138
-
139
-
140
-
141
-
142
-
143
-
144
-
145
-
146
-
147
-
148
-
149
-
150
-
151
-
152
-
153
-
154
-
155
-
156
-
157
-
158
-
159
-
160
 |
 |

87
Financial information 2008
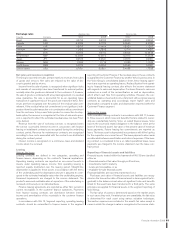
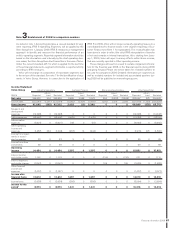
Note 3 Restatement of 2008 for comparison numbers
As stated in note 1 Accounting pinciples, a revised standard for seg-
ment reporting, IFRS 8 Operating Segments, will be applied by the
Volvo Group from 1 January 2009. IFRS 8 introduces a ‘management
approach’ to identify and measure the fi nancial performance of an
entity’s operating segments. Reported segment information should be
based on the information used internally by the chief operating deci-
sion maker, the Volvo Group Executive Committee in the case of Volvo.
Under the current standard, IAS 14, which is applied for the last time
in these fi nancial statements, segment information is reported strictly
according to IFRS measures.
Volvo will not change its composition of reportable segments due
to the revision of the standard. See note 7 for the identifi cation of seg-
ments in Volvo Group. However, in connection to the application of
IFRS 8 in 2009, Volvo will no longer reclassify operating leases on a
consolidated level to fi nance leases in the segment reporting of Cus-
tomer Finance (see Note 1 for explanation). The reclassifi cation has
been done in order to refl ect the strict IFRS interpretation of transfer
of risk and rewards in internal transactions. Also, starting from Janu-
ary 1, 2009, Volvo will report currency effects within Gross income,
that are currently reported in Other operating income.
These changes will result in a need to restate comparison informa-
tion for the fi nancial year 2008, in the fi nancial reports during 2009
and going forward. Please see below tables for restated numbers to
be used for comparison 2009. Detailed information per segments as
well as restated numbers for isolated and accumulated quarters dur-
ing 2008 will be published on www.volvogroup.com.
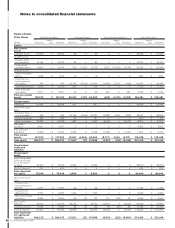
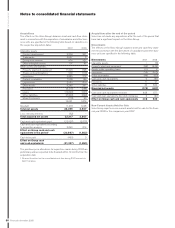
Income Statement
Volvo Group Industrial operations Customer Finance Elim and reclassifi cations Volvo Group Total
SEK M Reported
Adjust-
ment Restated Reported
Adjust-
ment Restated Reported
Adjust-
ment Restated Reported
Adjust-
ment Restated
Net sales 294,932 904 295,836 8,485 2,588 11,073 250 (2,518) (2,268) 303,667 975 304,642
Cost of sales (232,247) (1,267) (233,514) (5,082) (2,601) (7,683) (250) 2,518 2,268 (237,578) (1,350) (238,928)
Gross income 62,685 (363) 62,322 3,403 (13) 3,390 000 66,089 (376) 65,713
Research and
development
expenses (14,348) 0 (14,348) 000 000 (14,348) 0 (14,348)
Selling expenses (25,597) 0 (25,597) (1,532) 0 (1,532) 000 (27,129) 0 (27,129)
Administrative
expenses (6,921) 0 (6,921) (19) 0 (19) 000 (6,940) 0 (6,940)
Other operating
income and
expenses (1,457) 363 (1,094) (457) 13 (444) 000 (1,915) 376 (1,539)
Income from invest-
ments in associ-
ated companies 23 0 23 202 000 25 0 25
Income from other
investments 69 0 69 000 000 69 0 69
Operating
income 14,454 0 14,454 1,397 0 1,397 000 15,851 0 15,851
Interest income
and similar credits 1,297 0 1,297 000 (126) 0 (126) 1,171 0 1,171
Interest expenses
and similar charges (2,061) 0 (2,061) 000 126 0 126 (1,935) 0 (1,935)
Other fi nancial
income and
expenses (1,077) 0 (1,077) 00 0 000 (1,077) 0 (1,077)
Income after
fi nancial items 12,612 0 12,612 1,397 0 1,397 000 14,010 0 14,010
Income taxes (3,638) 0 (3,638) (356) 0 (356) 000 (3,994) 0 (3,994)
Income for the
period* 8,974 0 8,974 1,041 0 1,041 000 10,016 0 10,016