Volvo 2008 Annual Report Download - page 102
Download and view the complete annual report
Please find page 102 of the 2008 Volvo annual report below. You can navigate through the pages in the report by either clicking on the pages listed below, or by using the keyword search tool below to find specific information within the annual report.-
 1
1 -
2
-
3
-
4
-
5
-
6
-
7
-
8
-
9
-
10
-
11
-
12
-
13
-
14
-
15
-
16
-
17
-
18
-
19
-
20
-
21
-
22
-
23
-
24
-
25
-
26
-
27
-
28
-
29
-
30
-
31
-
32
-
33
-
34
-
35
-
36
-
37
-
38
-
39
-
40
-
41
-
42
-
43
-
44
-
45
-
46
-
47
-
48
-
49
-
50
-
51
-
52
-
53
-
54
-
55
-
56
-
57
-
58
-
59
-
60
-
61
-
62
-
63
-
64
-
65
-
66
-
67
-
68
-
69
-
70
-
71
-
72
-
73
-
74
-
75
-
76
-
77
-
78
-
79
-
80
-
81
-
82
-
83
-
84
-
85
-
86
-
87
-
88
-
89
-
90
-
91
-
 92
92 -
 93
93 -
 94
94 -
 95
95 -
 96
96 -
 97
97 -
 98
98 -
 99
99 -
 100
100 -
 101
101 -
 102
102 -
 103
103 -
 104
104 -
 105
105 -
 106
106 -
 107
107 -
 108
108 -
 109
109 -
 110
110 -
 111
111 -
 112
112 -
113
-
114
-
115
-
116
-
117
-
118
-
119
-
120
-
121
-
122
-
123
-
124
-
125
-
126
-
127
-
128
-
129
-
130
-
131
-
132
-
133
-
134
-
135
-
136
-
137
-
138
-
139
-
140
-
141
-
142
-
143
-
144
-
145
-
146
-
147
-
148
-
149
-
150
-
151
-
152
-
153
-
154
-
155
-
156
-
157
-
158
-
159
-
160
 |
 |
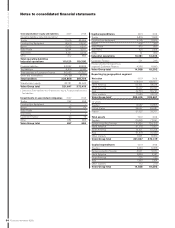
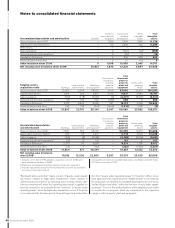
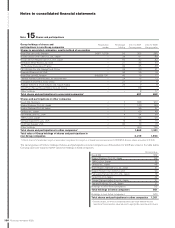
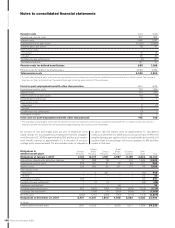
Notes to consolidated fi nancial statements
98
THE VOLVO GROUP
Financial information 2008
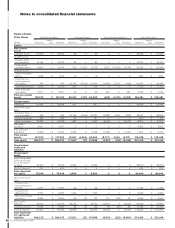
Accumulated depreciation and amortization Goodwill
Entrance
fees, industrial
programs
Product and
software
development
Other
intangible
assets
Total
intangible
assets
Value in balance sheet 2007 – 1,639 7,954 1,546 11,139
Depreciation and amortization – 60 2,864 362 3,286
Write-downs –––––
Sales/scrapping – 0 (547) (12) (559)
Acquired and divested operations3 – 0 (16) 0 (16)
Translation differences – 0 633 209 842
Reclassifi cations and other – 0 21 (12) 9
Value in balance sheet 2008 0 1,699 10,909 2,093 14,701
Net carrying value in balance sheet 2008424,813 1,870 12,381 4,894 43,958
Tangible assets,
acquisition costs Buildings
Land and land
improvements
Machinery
and equipment2
Construction
in progress,
including
advance
payments
Total
investment
property,
property,
plant and
equipment
Assets under
operating
leases
Total
tangible
assets
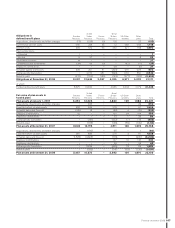
Value in balance sheet 2007 25,903 9,544 58,992 3,166 97,605 32,975 130,580
Capital expenditures 1,504 328 4,410 3,735 9,977 5,440 15,417
Sales/scrapping (319) (118) (2,567) (3) (3,007) (5,397) (8,404)
Acquired and divested operations366 196 532 (239) 555 0555
Translation differences 4,218 2,603 8,055 297 15,173 3,359 18,532
Reclassifi cations and other 525 148 (278) (1,609) (1,214) 1,205 (9)
Value in balance sheet 2008 31,897 12,701 69,144 5,347 119,089 37,582 156,671
Accumulated depreciation
and amortization Buildings
Land and land
improvements
Machinery
and equipment2
Construction
in progress,
including
advance
payments
Total
investment
property,
property,
plant and
equipment
Assets under
operating
leases
Total
tangible
assets
Value in balance sheet 2007 11,831 559 38,005 – 50,395 10,473 60,868
Depreciation and amortization5983 65 4,670 – 5,718 4,520 10,238
Sales/scrapping (192) (8) (2,288) – (2,488) (2,993) (5,481)
Acquired and divested operations3(13) 0 115 – 102 0102
Translation differences 2,270 50 5,994 – 8,314 1,158 9,472
Reclassifi cations and other (75) 5 (152) – (222) (1,005) (1,227)
Value in balance sheet 2008 14,804 671 46,344 – 61,819 12,153 73,972
Net carrying value in balance
sheet 2008417,093 12,030 22,800 5,347 57,270 25,429 82,699
1 Includes on the date of IFRS adoption, acquisition costs of 14,184 and
accumulated amortization of 3,863.
2 Machinery and equipment pertains mainly to production equipment.
3 Includes subsidiaries and joint ventures that previously were accounted for
according to the equity method.
4 Acquisition costs less accumulated depreciation, amortization and write-downs.
5 Of which write-down 57 (0).
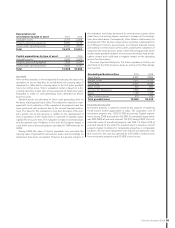
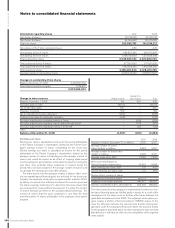
“Reclassifi cations and other” mainly consist of “assets under operat-
ing leases” related to legal sales transactions, where revenue is
deferred and accounted for as operating lease revenue. Assets clas-
sifi ed as inventory will, when the operating lease model is applied for
revenue recognition, be reclassifi ed from “inventory” to “assets under
operating leases”, when the legal sales transaction occurs. If the prod-
uct is returned after the lease period, there will again be a reclassifi ca-
tion from “assets under operating leases” to “inventory”. When a buy-
back agreement has expired, but the related product is not returned,
the acquisition cost and the accumulated depreciation are reversed in
“reclassifi cation and other”, within the line item “assets under operat-
ing leases”. Some of the reclassifi cations within tangible assets relate
to construction in progress, which are reclassifi ed to the respective
category within property, plant and equipment.