Volvo 2008 Annual Report Download - page 121
Download and view the complete annual report
Please find page 121 of the 2008 Volvo annual report below. You can navigate through the pages in the report by either clicking on the pages listed below, or by using the keyword search tool below to find specific information within the annual report.-
 1
1 -
2
-
3
-
4
-
5
-
6
-
7
-
8
-
9
-
10
-
11
-
12
-
13
-
14
-
15
-
16
-
17
-
18
-
19
-
20
-
21
-
22
-
23
-
24
-
25
-
26
-
27
-
28
-
29
-
30
-
31
-
32
-
33
-
34
-
35
-
36
-
37
-
38
-
39
-
40
-
41
-
42
-
43
-
44
-
45
-
46
-
47
-
48
-
49
-
50
-
51
-
52
-
53
-
54
-
55
-
56
-
57
-
58
-
59
-
60
-
61
-
62
-
63
-
64
-
65
-
66
-
67
-
68
-
69
-
70
-
71
-
72
-
73
-
74
-
75
-
76
-
77
-
78
-
79
-
80
-
81
-
82
-
83
-
84
-
85
-
86
-
87
-
88
-
89
-
90
-
91
-
92
-
93
-
94
-
95
-
96
-
97
-
98
-
99
-
100
-
101
-
102
-
103
-
104
-
105
-
106
-
107
-
108
-
109
-
110
-
 111
111 -
 112
112 -
 113
113 -
 114
114 -
 115
115 -
 116
116 -
 117
117 -
 118
118 -
 119
119 -
 120
120 -
 121
121 -
 122
122 -
 123
123 -
 124
124 -
 125
125 -
 126
126 -
 127
127 -
 128
128 -
 129
129 -
 130
130 -
 131
131 -
132
-
133
-
134
-
135
-
136
-
137
-
138
-
139
-
140
-
141
-
142
-
143
-
144
-
145
-
146
-
147
-
148
-
149
-
150
-
151
-
152
-
153
-
154
-
155
-
156
-
157
-
158
-
159
-
160
 |
 |

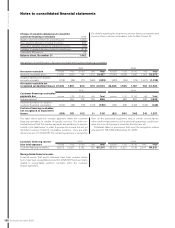
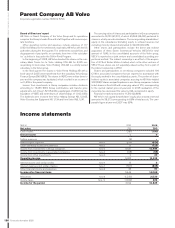
117
Financial information 2008
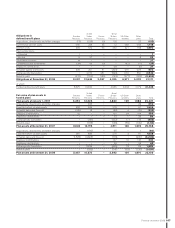
2007 2008
Average number of employees Number of
employees
of which
women, %
Number of
employees
of which
women, %
AB Volvo
Sweden 178 51 196 47
Subsidiaries
Sweden 27,826 20 28,126 21
Western Europe 27,340 15 27,584 18
Eastern Europe 5,027 18 5,694 20
North America 11,716 19 10,625 19
South America 4,664 13 4,328 13
Asia 12,824 10 17,924 11
Other countries 2,685 20 2,553 13
Group total 92,260 17 97,030 17
2007 2008
Board members and chief offi cers Number at
year-end
of which
women, %
Number at
year-end
of which
women, %
AB Volvo
Board members 11 9 11 9
CEO and GEC 18 6 18 6
Volvo Group
Board members 954 11 885 10
Presidents and other senior executives 1,678 15 1,701 17
2007 2008
Wages, salaries and other
remunerations, SEK M Board and
Presidents1
of which
variable
salaries
Other
employees
Board and
Presidents1
of which
variable
salaries
Other
employees
AB Volvo
Sweden 37.9 14.0 165.4 31.0 9.8 195.7
Subsidiaries
Sweden 79.2 30.6 10,426.3 78.3 30.7 11,550.3
Western Europe 495.9 24.3 10,482.3 514.3 10.2 10,628.7
Eastern Europe 56.8 7.3 863.5 50.1 11.8 1,087.2
North America 189.5 23.2 5,800.1 163.0 34.4 4,808.9
South America 15.3 1.7 766.7 26.5 16.5 974.1
Asia 168.3 13.0 3,564.5 125.3 16.6 4,840.1
Other countries 49.8 6.3 543.8 59.3 3.3 614.8
Group total 1,092.7 120.4 32,612.6 1,047.8 133.3 34,699.8
2007 2008
Wages, salaries and other remunerations
and social costs, SEK M
Wages,
salaries,
remunerations
Social
costs
of which
pens. costs
Wages,
salaries,
remunerations
Social
costs
of which
pens. costs
AB Volvo2203.3 106.9 66.0 226.7 107.1 62.1
Subsidiaries 33,502.0 10,638.0 3,868.8 35,520.9 11,632.9 4,487.9
Group total333,705.3 10,744.9 3,934.8 35,747.6 11,740.0 4,550.0
1 Including current and former Board members, Presidents and Executive
Vice Presidents.
2 The Parent Company’s pension costs, pertaining to Board members and
Presidents are disclosed in Note 21 in the Parent Company.
3 Of the Group’s pension costs, 170.8 (288.4) pertain to Board members and
Presidents, including current and former Board members, Presidents and
Executive Vice Presidents. The Group’s outstanding pension obligations to
these individuals amount to to 246.4 (183.3).
The cost for non-monetary benefi ts in the Group amounted to 1,615.0
(1,500.9) of which 43.9 (41.0) to Board members and Presidents.
The cost for non-monetary benefi ts in the Parent company
amounted to 13.0 (11.2) of which 1.8 (1.0) to Board members and
Presidents.