Volvo 2008 Annual Report Download - page 80
Download and view the complete annual report
Please find page 80 of the 2008 Volvo annual report below. You can navigate through the pages in the report by either clicking on the pages listed below, or by using the keyword search tool below to find specific information within the annual report.-
 1
1 -
2
-
3
-
4
-
5
-
6
-
7
-
8
-
9
-
10
-
11
-
12
-
13
-
14
-
15
-
16
-
17
-
18
-
19
-
20
-
21
-
22
-
23
-
24
-
25
-
26
-
27
-
28
-
29
-
30
-
31
-
32
-
33
-
34
-
35
-
36
-
37
-
38
-
39
-
40
-
41
-
42
-
43
-
44
-
45
-
46
-
47
-
48
-
49
-
50
-
51
-
52
-
53
-
54
-
55
-
56
-
57
-
58
-
59
-
60
-
61
-
62
-
63
-
64
-
65
-
66
-
67
-
68
-
69
-
 70
70 -
 71
71 -
 72
72 -
 73
73 -
 74
74 -
 75
75 -
 76
76 -
 77
77 -
 78
78 -
 79
79 -
 80
80 -
 81
81 -
 82
82 -
 83
83 -
 84
84 -
 85
85 -
 86
86 -
 87
87 -
 88
88 -
 89
89 -
 90
90 -
91
-
92
-
93
-
94
-
95
-
96
-
97
-
98
-
99
-
100
-
101
-
102
-
103
-
104
-
105
-
106
-
107
-
108
-
109
-
110
-
111
-
112
-
113
-
114
-
115
-
116
-
117
-
118
-
119
-
120
-
121
-
122
-
123
-
124
-
125
-
126
-
127
-
128
-
129
-
130
-
131
-
132
-
133
-
134
-
135
-
136
-
137
-
138
-
139
-
140
-
141
-
142
-
143
-
144
-
145
-
146
-
147
-
148
-
149
-
150
-
151
-
152
-
153
-
154
-
155
-
156
-
157
-
158
-
159
-
160
 |
 |

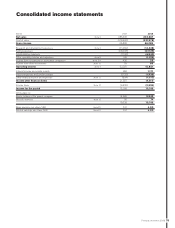
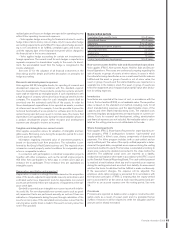
Financial information 2008
76
THE VOLVO GROUP
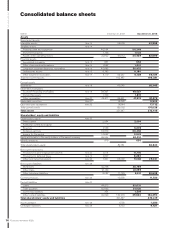
Consolidated balance sheets
SEK M December 31, 2007 December 31, 2008
Assets
Non-current assets
Intangible assets Note 14 36,508 43,958
Tangible assets Note 14
Property, plant and equipment 46,054 56,248
Investment property 1,156 1,022
Assets under operating leases 22,502 69,712 25,429 82,699
Financial assets
Associated companies Note 15 657 652
Other shares and participations Note 15 1,562 1,301
Long-term customer-fi nancing receivables Note 16 40,486 50,432
Deferred tax assets Note 12 8,783 11,180
Other long-term receivables Note 17 4,779 56,267 6,159 69,724
Total non-current assets 162,487 196,381
Current assets
Inventories Note 18 43,645 55,045
Short-term receivables
Customer-fi nancing receivables Note 19 38,361 48,057
Current tax assets 1,703 1,810
Other receivables Note 20 44,417 84,481 47,512 97,379
Marketable securities Note 21 16,490 5,902
Cash and cash equivalents Note 22 14,544 17,712
Total current assets 159,160 176,038
Total assets 321,647 372,419
Shareholders’ equity and liabilities
Shareholders’ equity Note 23
Share capital 2,554 2,554
Additional contributed capital – –
Reserves 2,146 5,078
Retained earnings 62,570 66,436
Income for the period 14,932 9,942
Equity attributable to the equity holders of the parent company 82,202 84,010
Minority interests 579 630
Total shareholders’ equity 82,781 84,640
Non-current provisions
Provisions for post-employment benefi ts Note 24 9,774 11,705
Provisions for deferred taxes Note 12 9,127 8,260
Other non-current provisions Note 25 7,301 26,202 9,066 29,031
Non-current liabilities Note 26
Bond loans 42,298 35,798
Other loans 21,149 47,299
Other long-term liabilities 8,282 71,729 9,511 92,608
Current provisions Note 25 10,656 11,750
Current liabilities Note 27
Loans 44,872 62,631
Trade payables 52,663 51,025
Current tax liabilities 451 1,204
Other current liabilities 32,293 130,279 39,530 154,390
Total shareholders’ equity and liabilities 321,647 372,419
Assets pledged Note 28 1,556 1,380
Contingent liabilities Note 29 8,153 9,427