Volvo 2008 Annual Report Download - page 114
Download and view the complete annual report
Please find page 114 of the 2008 Volvo annual report below. You can navigate through the pages in the report by either clicking on the pages listed below, or by using the keyword search tool below to find specific information within the annual report.-
 1
1 -
2
-
3
-
4
-
5
-
6
-
7
-
8
-
9
-
10
-
11
-
12
-
13
-
14
-
15
-
16
-
17
-
18
-
19
-
20
-
21
-
22
-
23
-
24
-
25
-
26
-
27
-
28
-
29
-
30
-
31
-
32
-
33
-
34
-
35
-
36
-
37
-
38
-
39
-
40
-
41
-
42
-
43
-
44
-
45
-
46
-
47
-
48
-
49
-
50
-
51
-
52
-
53
-
54
-
55
-
56
-
57
-
58
-
59
-
60
-
61
-
62
-
63
-
64
-
65
-
66
-
67
-
68
-
69
-
70
-
71
-
72
-
73
-
74
-
75
-
76
-
77
-
78
-
79
-
80
-
81
-
82
-
83
-
84
-
85
-
86
-
87
-
88
-
89
-
90
-
91
-
92
-
93
-
94
-
95
-
96
-
97
-
98
-
99
-
100
-
101
-
102
-
103
-
 104
104 -
 105
105 -
 106
106 -
 107
107 -
 108
108 -
 109
109 -
 110
110 -
 111
111 -
 112
112 -
 113
113 -
 114
114 -
 115
115 -
 116
116 -
 117
117 -
 118
118 -
 119
119 -
 120
120 -
 121
121 -
 122
122 -
 123
123 -
 124
124 -
125
-
126
-
127
-
128
-
129
-
130
-
131
-
132
-
133
-
134
-
135
-
136
-
137
-
138
-
139
-
140
-
141
-
142
-
143
-
144
-
145
-
146
-
147
-
148
-
149
-
150
-
151
-
152
-
153
-
154
-
155
-
156
-
157
-
158
-
159
-
160
 |
 |

Notes to consolidated fi nancial statements
110
THE VOLVO GROUP
Financial information 2008
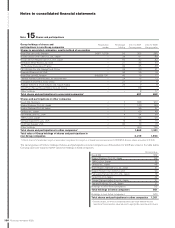
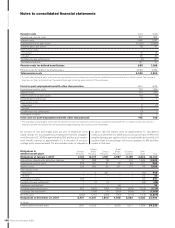
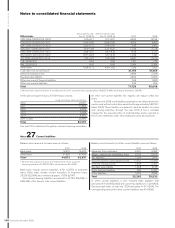
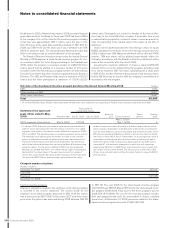
Other loans Actual interest rate,
Dec 31, 2008, %
Effective interest rate,
Dec 31, 2008, % 2007 2008
USD 2004–2008/2010–2018 2.15–5.17 2.17–5.27 3,522 10,134
EUR 2003–2008/2010–2017 3.45–6.50 3.48–6.50 4,076 5,419
GBP 2005–2008/2010–2012 2.63–6.72 2.66–6.89 520 1,952
SEK 2007–2008/2010–2017 2.69–7.98 2.72–8.22 1,228 3,778
CAD 2004–2008/2010–2013 2.84–4.07 2.87–4.13 1,518 2,712
MXN 2005–2007/2010–2012 8.81–9.33 9.17–9.74 1,239 1,197
JPY 2005–2008/2010–2016 1.22–2.07 1.22–2.08 4,631 17,076
CHF 2006/2011 2.53 2.55 1,141 735
BRL 2003/2017 8.42 8.89 2,085 2,994
Other loans 4.85–6.73 4.94–7.89 1,189 1,302
Total other non-current loans2 21,149 47,299
Deferred leasing income 2,894 2,508
Residual value liability 4,440 4,350
Other non-current fi nancial liabilities 523 1,658
Other non-current liabilities 425 995
Total 71,729 92,608
2 Whereof loans raised to fi nance the credit portfolio of the customer fi nancing operations 34,955 (13,449) and fi nancial derivatives 198 (74).
Of the above long-term loans, 374 (541) was secured.
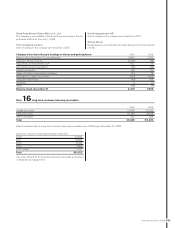
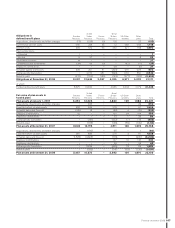
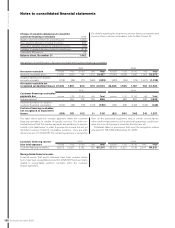
Long-term loans mature as follows:
2010 23,951
2011 17,359
2012 6,703
2013 9,594
2014 4,500
2015 or later 20,990
Total 83,097
See note 16 for maturities of long-term customer fi nancing receivables.
Of other non-current liabilities the majority will mature within fi ve
years.
At year-end 2008, credit facilities granted but not utilized and which
can be used without restrictions amounted to approximately SEK 26.7
billion (23.2). These facilities consisted of stand-by facilities for loans
with varying maturities through the year 2013. A fee is normally
charged for the unused portion of credit facilities and is reported in
the income statement under other fi nancial income and expenses.
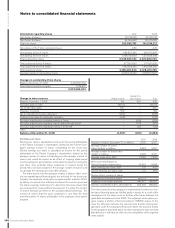
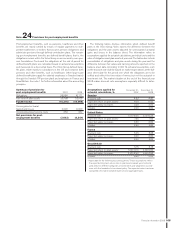
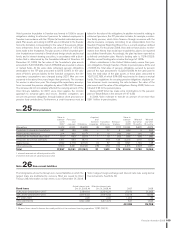
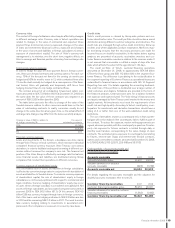
Note 27 Current liabilities
Balance sheet amounts for loans were as follows:
2007 2008
Bank loans 12,979 15,222
Other loans 31,893 47,409
Total144,872 62,631
1 Whereof loans raised to fi nance the credit portfolio of the customer
fi nancing operations 47,180 (32,797) and derivatives 604 (242).
Bank loans include current maturities, 4,701 (2,975), of long-term
loans. Other loans include current maturities of long-term loans,
26,336 (22,554), and commercial paper, 17,876 (6,547).
Non-interest-bearing liabilities accounted for 91,759 (85,406), or
59% (66) of the Group’s total current liabilities.
Balance sheet amounts for Other current liabilities were as follows:
2007 2008
Advances from customers 3,321 3,352
Wages, salaries and withholding taxes 6,703 6,978
VAT liabilities 1,524 1,455
Accrued expenses and prepaid income 12,161 13,440
Deferred leasing income 1,864 2,203
Residual value liability 1,928 2,138
Other fi nancial liabilities 982 5,430
Other liabilities 3,810 4,534
Total 32,293 39,530
In Other current liabilities is also included trade payables that
amounted to 51,025 (52,663) and current tax liabilities to 1,204 (451).
Secured bank loans at year-end 2008 amounted to 312 (264). The
corresponding amount for other current liabilities was 416 (590).