Volvo 2008 Annual Report Download - page 82
Download and view the complete annual report
Please find page 82 of the 2008 Volvo annual report below. You can navigate through the pages in the report by either clicking on the pages listed below, or by using the keyword search tool below to find specific information within the annual report.-
 1
1 -
2
-
3
-
4
-
5
-
6
-
7
-
8
-
9
-
10
-
11
-
12
-
13
-
14
-
15
-
16
-
17
-
18
-
19
-
20
-
21
-
22
-
23
-
24
-
25
-
26
-
27
-
28
-
29
-
30
-
31
-
32
-
33
-
34
-
35
-
36
-
37
-
38
-
39
-
40
-
41
-
42
-
43
-
44
-
45
-
46
-
47
-
48
-
49
-
50
-
51
-
52
-
53
-
54
-
55
-
56
-
57
-
58
-
59
-
60
-
61
-
62
-
63
-
64
-
65
-
66
-
67
-
68
-
69
-
70
-
71
-
 72
72 -
 73
73 -
 74
74 -
 75
75 -
 76
76 -
 77
77 -
 78
78 -
 79
79 -
 80
80 -
 81
81 -
 82
82 -
 83
83 -
 84
84 -
 85
85 -
 86
86 -
 87
87 -
 88
88 -
 89
89 -
 90
90 -
 91
91 -
 92
92 -
93
-
94
-
95
-
96
-
97
-
98
-
99
-
100
-
101
-
102
-
103
-
104
-
105
-
106
-
107
-
108
-
109
-
110
-
111
-
112
-
113
-
114
-
115
-
116
-
117
-
118
-
119
-
120
-
121
-
122
-
123
-
124
-
125
-
126
-
127
-
128
-
129
-
130
-
131
-
132
-
133
-
134
-
135
-
136
-
137
-
138
-
139
-
140
-
141
-
142
-
143
-
144
-
145
-
146
-
147
-
148
-
149
-
150
-
151
-
152
-
153
-
154
-
155
-
156
-
157
-
158
-
159
-
160
 |
 |

Financial information 2008
78
THE VOLVO GROUP
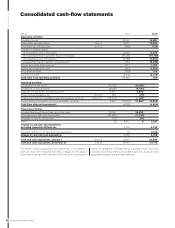
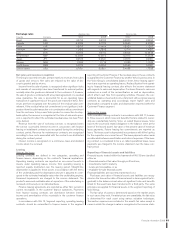
Consolidated cash-fl ow statements
SEK M 2007 2008
Operating activities
Operating income 22,231 15,851
Depreciation and amortization Note 14 12,474 13,524
Other items not affecting cash Note 30 (458) (133)
Changes in working capital:
(Increase)/decrease in receivables (2,692) 3,209
(Increase)/decrease in customer fi nance receivables (10,031) (10,174)
(Increase)/decrease in inventories (4,436) (6,664)
Increase/(decrease) in liabilities and provisions 7,166 (9,675)
Interest and similar items received 1,077 1,100
Interest and similar items paid (832) (1,302)
Other fi nancial items (139) 109
Income taxes paid (5,970) (5,076)
Cash-fl ow from operating activities 18,390 769
Investing activities
Investments in fi xed assets (10,150) (12,664)
Investments in leasing assets (4,800) (5,440)
Disposals of fi xed assets and leasing assets 2,945 2,905
Shares and participations, net Note 30 436 (29)
Acquired and divested subsidiaries and other business units, net Note 4, 30 (15,013) (1,317)
Interest-bearing receivables including marketable securities 3,554 (23,028) 10,882 (5,663)
Cash-fl ow after net investments (4,638) (4,894)
Financing activities
Increase/(decrease) in bond loans and other loans 28,746 18,230
Cash payment to AB Volvo shareholders’ (20,255) (11,150)
Dividends to minority shareholders (78) (54)
Other (3) 8,410 8 7,034
Change in cash and cash equivalents,
excluding translation differences 3,772 2,140
Translation difference on cash and cash equivalents 15 1,028
Change in cash and cash equivalents 3,787 3,168
Cash and cash equivalents, January 1 Note 22 10,757 14,544
Cash and cash equivalents, December 31 Note 22 14,544 17,712
The effects of major acquisitions and divestments of subsidiaries in
each year have been excluded from other changes for the balance
sheet items in the cash-fl ow statement. The effects of currency move-
ments in translation of foreign Group companies have also been
excluded since these effects do not affect cash fl ow. Cash and cash
equivalents include cash and bank balances.