Volvo 2008 Annual Report Download - page 42
Download and view the complete annual report
Please find page 42 of the 2008 Volvo annual report below. You can navigate through the pages in the report by either clicking on the pages listed below, or by using the keyword search tool below to find specific information within the annual report.-
 1
1 -
2
-
3
-
4
-
5
-
6
-
7
-
8
-
9
-
10
-
11
-
12
-
13
-
14
-
15
-
16
-
17
-
18
-
19
-
20
-
21
-
22
-
23
-
24
-
25
-
26
-
27
-
28
-
29
-
30
-
31
-
 32
32 -
 33
33 -
 34
34 -
 35
35 -
 36
36 -
 37
37 -
 38
38 -
 39
39 -
 40
40 -
 41
41 -
 42
42 -
 43
43 -
 44
44 -
 45
45 -
 46
46 -
 47
47 -
 48
48 -
 49
49 -
 50
50 -
 51
51 -
 52
52 -
53
-
54
-
55
-
56
-
57
-
58
-
59
-
60
-
61
-
62
-
63
-
64
-
65
-
66
-
67
-
68
-
69
-
70
-
71
-
72
-
73
-
74
-
75
-
76
-
77
-
78
-
79
-
80
-
81
-
82
-
83
-
84
-
85
-
86
-
87
-
88
-
89
-
90
-
91
-
92
-
93
-
94
-
95
-
96
-
97
-
98
-
99
-
100
-
101
-
102
-
103
-
104
-
105
-
106
-
107
-
108
-
109
-
110
-
111
-
112
-
113
-
114
-
115
-
116
-
117
-
118
-
119
-
120
-
121
-
122
-
123
-
124
-
125
-
126
-
127
-
128
-
129
-
130
-
131
-
132
-
133
-
134
-
135
-
136
-
137
-
138
-
139
-
140
-
141
-
142
-
143
-
144
-
145
-
146
-
147
-
148
-
149
-
150
-
151
-
152
-
153
-
154
-
155
-
156
-
157
-
158
-
159
-
160
 |
 |

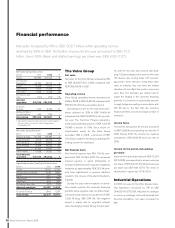
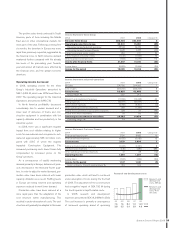
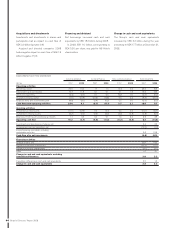
Financial performance
Net sales increased by 6% to SEK 303.7 billion, while operating income
declined by 29% to SEK 15.9 billion. Income for the year amounted to SEK 10.0
billion, down 33%. Basic and diluted earnings per share was SEK 4.90 (7.37).
Net sales by business area
SEK M 2007 2008 %
Trucks 187,892 203,235 8
Construction
Equipment 53,633 56,079 5
Buses 16,608 17,312 4
Volvo Penta 11,719 11,433 (2)
Volvo Aero 7,646 7,448 (3)
Eliminations and
other (703) (575) (18)
Industrial
operations1276,795 294,932 7
Customer
Finance 7,705 8,485 10
Reclassifi cations
and eliminations 905 250 –
Volvo Group 285,405 303,667 6
1 Adjusted for acquired and divested units and changes in
currency rates, net sales for Industrial operations
increased by 4%.
Operating income (loss) by business area
SEK M 2007 2008
Trucks 15,193 12,167
Construction Equipment 4,218 1,808
Buses 231 (76)
Volvo Penta 1,173 928
Volvo Aero 529 359
Eliminations and other (761) (732)
Industrial operations 20,583 14,454
Customer Finance 1,649 1,397
Volvo Group 22,231 15,851
Net sales by market area
SEK m 2007 2008 %
Western Europe 124,239 123,881 0
Eastern Europe 27,116 28,126 4
North America 49,435 47,600 (4)
South America 15,638 19,553 25
Asia 42,429 55,641 31
Other markets 17,938 20,131 12
Total Industrial
operations 276,795 294,932 7
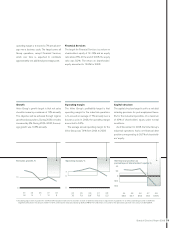
The Volvo Group
Net sales
Net sales for the Volvo Group increased by 6%
to SEK 303,667 M in 2008, compared with
SEK 285,405 M in 2007.
Operating income
Volvo Group operating income decreased by
29% in 2008 to SEK 15,851 M compared with
SEK 22,231 M in the year-earlier period.
Operating income for the Industrial oper-
ations declined by 30% to SEK 14,454 M
compared with SEK 20,583 M in the preced-
ing year. The Customer Finance operations
achieved an operating income of SEK 1,397 M
(1,649) a decline of 15%. Since return on
shareholders' equity for the Volvo Group
exceeded 12% in 2008, a provision of SEK
150 M was made for the Group's global profi t-
sharing system for employees.
Net fi nancial items
Net interest expense was SEK 764 M, com-
pared with SEK 170 M in 2007. The increased
interest expense is partly attributable to
increased debt level and it was also negativley
impacted by approximatley SEK 200 M prim-
arily from adjustments in pension liabilities
related to the closure of the plant in Goderich,
Canada.
During the year, market valuation of deriva-
tives mainly used for the customer fi nancing
portfolio had a negative effect on Other fi nan-
cial income and expenses in an amount of SEK
1,029 M (neg. SEK 384 M). The negative
impact is mainly due to long-term interest
rates decreasing sharply during the last quar-
ter, with the two-year euro interest rate drop-
ping 1.80 percentage points and the two-year
US interest rate coming down 2.07 percent-
age points. Volvo intends to keep these deri-
vates to maturity, why, over time, the market
valuation will not affect the result or cause any
cash fl ow. The derivates are mainly held to
match the lending in the customer fi nancing
portfolio. It is however not practically possible
to apply hedge accounting in accordance with
IAS 39 due to the fact that the customer
fi nance portfolio consists of a large number of
contracts.
Income Taxes
The income tax expense for the year amounted
to SEK 3,994 M corresponding to a tax rate of
29%. During 2007 the income tax expense
amounted to SEK 6,529 M and a tax rate of
30%.
Income for the period and earnings
per share
Income for the period amounted to SEK 10,016
M (15,028), corresponding to a basic earnings
per share of SEK 4.90 (7.37). Diluted earnings
per share was SEK 4.90 (7.37). The return of
shareholders’ equity was 12.1% (18.1).
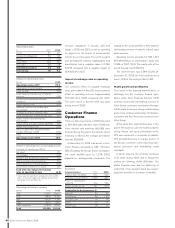
Industrial Operations
In 2008, net sales for the Volvo Group’s Indus-
trial Operations increased by 7% to SEK
294,932 M (276,795). Adjusted for changes
in currency exchange rates and acquired and
divested operations, net sales increased by
4%.
38 Board of Directors’ Report 2008