Volvo 2008 Annual Report Download - page 153
Download and view the complete annual report
Please find page 153 of the 2008 Volvo annual report below. You can navigate through the pages in the report by either clicking on the pages listed below, or by using the keyword search tool below to find specific information within the annual report.-
 1
1 -
2
-
3
-
4
-
5
-
6
-
7
-
8
-
9
-
10
-
11
-
12
-
13
-
14
-
15
-
16
-
17
-
18
-
19
-
20
-
21
-
22
-
23
-
24
-
25
-
26
-
27
-
28
-
29
-
30
-
31
-
32
-
33
-
34
-
35
-
36
-
37
-
38
-
39
-
40
-
41
-
42
-
43
-
44
-
45
-
46
-
47
-
48
-
49
-
50
-
51
-
52
-
53
-
54
-
55
-
56
-
57
-
58
-
59
-
60
-
61
-
62
-
63
-
64
-
65
-
66
-
67
-
68
-
69
-
70
-
71
-
72
-
73
-
74
-
75
-
76
-
77
-
78
-
79
-
80
-
81
-
82
-
83
-
84
-
85
-
86
-
87
-
88
-
89
-
90
-
91
-
92
-
93
-
94
-
95
-
96
-
97
-
98
-
99
-
100
-
101
-
102
-
103
-
104
-
105
-
106
-
107
-
108
-
109
-
110
-
111
-
112
-
113
-
114
-
115
-
116
-
117
-
118
-
119
-
120
-
121
-
122
-
123
-
124
-
125
-
126
-
127
-
128
-
129
-
130
-
131
-
132
-
133
-
134
-
135
-
136
-
137
-
138
-
139
-
140
-
141
-
142
-
 143
143 -
 144
144 -
 145
145 -
 146
146 -
 147
147 -
 148
148 -
 149
149 -
 150
150 -
 151
151 -
 152
152 -
 153
153 -
 154
154 -
 155
155 -
 156
156 -
 157
157 -
 158
158 -
 159
159 -
 160
160
 |
 |

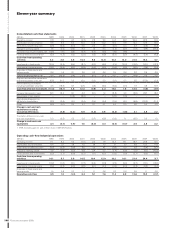
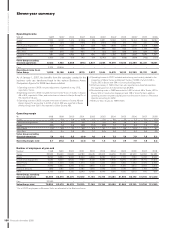
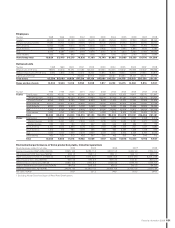
149
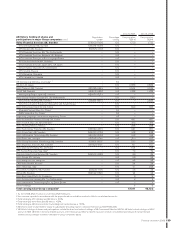
Financial information 2008
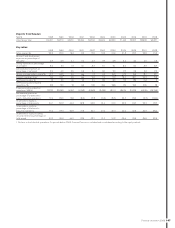
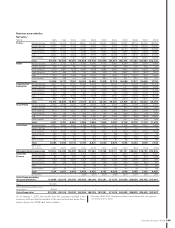
Business area statistics
Net sales1
SEK M 1998 1999 2000 2001 2002 2003 2004 2005 2006 2007 2008
Trucks Western Europe 27,837 30,006 30,415 60,841 61,406 63,097 68,664 70,567 80,116 86,035 86,994
Eastern Europe 3,089 2,265 3,158 5,526 6,424 7,004 8,767 9,139 13,166 22,616 22,920
North America 17,659 22,303 17,048 33,630 33,721 28,151 35,154 46,129 50,605 27,255 26,588
South America 3,777 2,190 3,111 3,993 3,277 3,464 5,223 7,657 9,213 11,483 14,680
Asia 2,047 2,010 3,432 4,659 5,919 9,206 12,378 13,551 8,975 26,593 37,515
Other markets 1,267 1,492 1,911 7,919 8,005 6,047 6,693 8,353 9,190 13,910 14,538
Total 55,676 60,266 59,075 116,568 118,752 116,969 136,879 155,396 171,265 187,892 203,235
Buses Western Europe 5,528 5,735 6,767 6,263 6,695 6,153 6,422 6,564 7,390 7,204 6,987
Eastern Europe 366 226 182 373 409 381 526 578 534 563 334
North America 5,574 6,871 7,723 6,847 3,838 2,984 2,960 4,247 4,910 4,630 5,355
South America 910 469 732 757 366 329 521 2,641 1,537 1,623 1,571
Asia 1,519 943 1,269 1,839 2,022 1,447 1,632 1,612 2,003 1,802 2,094
Other markets 389 469 514 596 705 684 661 947 897 786 971
Total 14,286 14,713 17,187 16,675 14,035 11,978 12,722 16,589 17,271 16,608 17,312
Construction Western Europe 9,557 9,901 10,029 10,326 10,383 11,576 12,443 14,213 18,438 21,852 20,763
Equipment Eastern Europe 336 193 255 341 454 772 1,010 1,311 1,888 3,442 4,429
North America 6,548 5,725 5,823 6,145 5,667 5,428 8,601 10,337 11,280 11,170 10,159
South America 957 498 776 847 709 636 922 1,238 1,358 2,155 2,913
Asia 1,092 1,903 2,484 2,773 3,048 3,707 4,961 5,717 6,903 12,179 13,738
Other markets 882 662 626 703 751 1,035 1,423 2,000 2,264 2,835 4,077
Total 19,372 18,882 19,993 21,135 21,012 23,154 29,360 34,816 42,131 53,633 56,079
Volvo Penta Western Europe 2,725 2,986 3,204 3,789 3,846 4,081 4,723 4,845 5,748 6,290 6,100
Eastern Europe 23 26 30 38 99 108 184 257 363 508 454
North America 1,412 1,770 2,257 2,175 2,261 2,109 2,500 2,832 2,815 2,674 1,947
South America 153 134 160 213 127 146 142 208 221 274 364
Asia 476 692 794 988 1,141 947 1,324 1,427 1,359 1,624 2,082
Other markets 142 153 154 177 195 205 184 207 268 349 486
Total 4,931 5,761 6,599 7,380 7,669 7,596 9,057 9,776 10,774 11,719 11,433
Volvo Aero Western Europe 4,231 4,560 4,651 4,788 3,422 3,951 3,130 3,346 3,674 3,431 3,468
Eastern Europe 47 16 42 87 28 49 49 60 124 31 29
North America 3,502 4,557 5,040 5,841 4,573 3,301 3,127 3,612 3,815 3,723 3,534
South America 284 193 134 187 177 152 138 168 173 127 58
Asia 336 491 701 708 497 428 400 284 356 234 234
Other markets 184 136 145 173 140 149 81 68 91 100 125
Total 8,584 9,953 10,713 11,784 8,837 8,030 6,925 7,538 8,233 7,646 7,448
Other and
eliminations 4,781 6,807 6,825 7,073 6,775 7,041 7,228 7,076 (654) (703) (575)
Net sales Industrial operations 107,630 116,382 120,392 180,615 177,080 174,768 202,171 231,191 249,020 276,795 294,932
Customer Western Europe 5,465 6,300 6,240 5,314 5,573 5,604 6,114 4,213 4,009 3,845 6,021
Finance Eastern Europe 86 185 257 360 424 474 499 584 379 639 1,078
North America 1,152 1,620 2,626 3,216 3,344 2,542 2,432 2,036 2,569 2,467 369
South America 297 455 452 451 403 358 396 570 608 620 791
Asia 01024 49 65 90 101 45 87 158
Other markets 224 76 103 130 132 110 67 45 38 47 68
Total 7,224 8,637 9,678 9,495 9,925 9,153 9,598 7,549 7,648 7,705 8,485
Eliminations –––(830) (807) (630) (693) 1,819 2,167 905 250
Volvo Group excluding
divested operations 114,854 125,019 130,070 189,280 186,198 183,291 211,076 240,559 258,835 285,405 303,667
Cars 103,798 –– –– – – – –– –
Other divested operations and
eliminations (5,716) –– –– – – – –– –
Volvo Group total 212,936 125,019 130,070 189,280 186,198 183,291 211,076 240,559 258,835 285,405 303,667
As of January 1, 2007, the results from the synergies created in the
business units are transferred back to the various business areas. Com-
parison fi gures for 2006 have been restated.
1 Net sales 1998–2001 have been restated in accordance with new organiza-
tion effective from 2002.