Volvo 2008 Annual Report Download - page 148
Download and view the complete annual report
Please find page 148 of the 2008 Volvo annual report below. You can navigate through the pages in the report by either clicking on the pages listed below, or by using the keyword search tool below to find specific information within the annual report.-
 1
1 -
2
-
3
-
4
-
5
-
6
-
7
-
8
-
9
-
10
-
11
-
12
-
13
-
14
-
15
-
16
-
17
-
18
-
19
-
20
-
21
-
22
-
23
-
24
-
25
-
26
-
27
-
28
-
29
-
30
-
31
-
32
-
33
-
34
-
35
-
36
-
37
-
38
-
39
-
40
-
41
-
42
-
43
-
44
-
45
-
46
-
47
-
48
-
49
-
50
-
51
-
52
-
53
-
54
-
55
-
56
-
57
-
58
-
59
-
60
-
61
-
62
-
63
-
64
-
65
-
66
-
67
-
68
-
69
-
70
-
71
-
72
-
73
-
74
-
75
-
76
-
77
-
78
-
79
-
80
-
81
-
82
-
83
-
84
-
85
-
86
-
87
-
88
-
89
-
90
-
91
-
92
-
93
-
94
-
95
-
96
-
97
-
98
-
99
-
100
-
101
-
102
-
103
-
104
-
105
-
106
-
107
-
108
-
109
-
110
-
111
-
112
-
113
-
114
-
115
-
116
-
117
-
118
-
119
-
120
-
121
-
122
-
123
-
124
-
125
-
126
-
127
-
128
-
129
-
130
-
131
-
132
-
133
-
134
-
135
-
136
-
137
-
 138
138 -
 139
139 -
 140
140 -
 141
141 -
 142
142 -
 143
143 -
 144
144 -
 145
145 -
 146
146 -
 147
147 -
 148
148 -
 149
149 -
 150
150 -
 151
151 -
 152
152 -
 153
153 -
 154
154 -
 155
155 -
 156
156 -
 157
157 -
 158
158 -
159
-
160
 |
 |

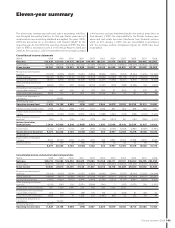
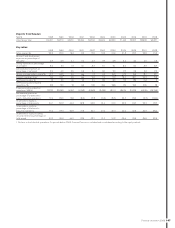
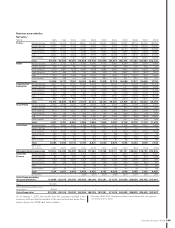
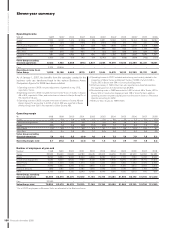
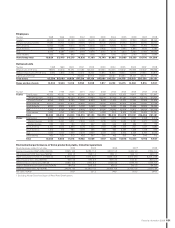
Eleven-year summary
144
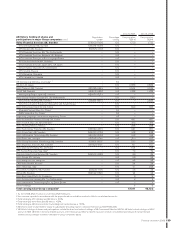
ELEVEN-YEAR SUMMARY
Financial information 2008
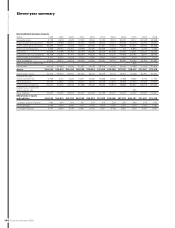
Consolidated balance sheets
SEK M 1998 1999 2000 2001 2002 2003 2004 2005 2006 2007 2008
Intangible assets 5,778 6,618 6,925 17,525 17,045 16,756 17,612 20,421 19,117 36,508 43,958
Property, plant and equipment 36,207 19,788 22,231 33,234 30,799 30,640 31,151 35,068 34,379 47,210 57,270
Assets under operating leases 22,285 12,337 14,216 27,101 23,525 21,201 19,534 20,839 20,501 22,502 25,429
Shares and participations 3,393 29,213 30,481 27,798 27,492 22,206 2,003 751 6,890 2,219 1,953
Inventories 32,128 21,438 23,551 31,075 28,305 26,459 28,598 33,937 34,211 43,645 55,045
Customer-fi nancing receivables 46,798 34,313 41,791 48,784 46,998 46,002 51,193 64,466 64,742 78,847 98,489
Interest-bearing receivables 4,735 18,617 19,228 8,079 5,490 6,632 3,384 1,897 4,116 4,530 5,101
Other receivables 34,197 24,019 26,352 39,946 33,990 32,621 35,747 42,881 42,567 55,152 61,560
Non-current assets held for sale ––––––––805 ––
Liquid funds 20,224 29,269 15,968 27,383 25,578 28,735 34,746 36,947 31,099 31,034 23,614
Assets 205,745 195,612 200,743 260,925 239,222 231,252 223,968 257,207 258,427 321,647 372,419
Shareholders’ equity170,235 98,236 88,931 85,576 78,525 72,636 70,155 78,760 87,188 82,781 84,640
Provision for post-
employment benefi ts 2,936 2,130 2,632 14,647 16,236 15,288 14,703 11,986 8,692 9,774 11,705
Other provisions 25,187 14,832 14,941 18,427 16,721 15,048 14,993 18,556 20,970 27,084 29,076
Interest-bearing liabilities 64,230 53,345 66,233 81,568 72,437 74,092 61,807 74,885 66,957 108,318 145,727
Liabilities associated with
assets held for sale ––––––––280 ––
Other liabilities 43,157 27,069 28,006 60,707 55,303 54,188 62,310 73,020 74,340 93,690 101,271
Shareholders’ equity
and liabilities 205,745 195,612 200,743 260,925 239,222 231,252 223,968 257,207 258,427 321,647 372,419
1 of which minority interests 860 544 593 391 247 216 229 260 284 579 630
Assets pledged 5,388 3,930 2,990 3,737 3,610 3,809 3,046 3,255 1,960 1,556 1,380
Contingent liabilities 6,737 6,666 6,789 10,441 9,334 9,611 9,189 7,850 7,726 8,153 9,427