Volvo 2008 Annual Report Download - page 155
Download and view the complete annual report
Please find page 155 of the 2008 Volvo annual report below. You can navigate through the pages in the report by either clicking on the pages listed below, or by using the keyword search tool below to find specific information within the annual report.-
 1
1 -
2
-
3
-
4
-
5
-
6
-
7
-
8
-
9
-
10
-
11
-
12
-
13
-
14
-
15
-
16
-
17
-
18
-
19
-
20
-
21
-
22
-
23
-
24
-
25
-
26
-
27
-
28
-
29
-
30
-
31
-
32
-
33
-
34
-
35
-
36
-
37
-
38
-
39
-
40
-
41
-
42
-
43
-
44
-
45
-
46
-
47
-
48
-
49
-
50
-
51
-
52
-
53
-
54
-
55
-
56
-
57
-
58
-
59
-
60
-
61
-
62
-
63
-
64
-
65
-
66
-
67
-
68
-
69
-
70
-
71
-
72
-
73
-
74
-
75
-
76
-
77
-
78
-
79
-
80
-
81
-
82
-
83
-
84
-
85
-
86
-
87
-
88
-
89
-
90
-
91
-
92
-
93
-
94
-
95
-
96
-
97
-
98
-
99
-
100
-
101
-
102
-
103
-
104
-
105
-
106
-
107
-
108
-
109
-
110
-
111
-
112
-
113
-
114
-
115
-
116
-
117
-
118
-
119
-
120
-
121
-
122
-
123
-
124
-
125
-
126
-
127
-
128
-
129
-
130
-
131
-
132
-
133
-
134
-
135
-
136
-
137
-
138
-
139
-
140
-
141
-
142
-
143
-
144
-
 145
145 -
 146
146 -
 147
147 -
 148
148 -
 149
149 -
 150
150 -
 151
151 -
 152
152 -
 153
153 -
 154
154 -
 155
155 -
 156
156 -
 157
157 -
 158
158 -
 159
159 -
 160
160
 |
 |

151
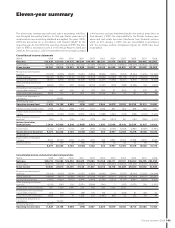
Financial information 2008
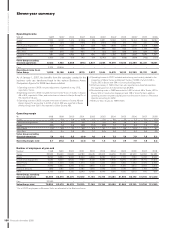
Employees
Number 1998 1999 2000 2001 2002 2003 2004 2005 2006 2007 2008
Sweden 43,900 24,840 25,030 24,350 25,420 26,380 28,530 27,070 27,830 28,660 28,190
Europe, excluding Sweden 17,880 11,900 12,320 27,800 27,130 29,120 28,930 29,650 30,070 32,780 32,940
North America 12,100 11,880 11,410 12,670 12,440 12,270 14,620 15,140 14,820 15,750 14,200
South America 1,980 1,930 2,100 2,090 2,020 2,640 3,110 3,690 3,890 4,640 4,380
Asia 3,340 2,480 2,570 2,550 2,590 3,710 4,130 4,210 4,420 17,150 19,090
Other markets 620 440 840 1,460 1,560 1,620 1,760 2,100 2,160 2,720 2,580
Volvo Group total 79,820 53,470 54,270 70,920 71,160 75,740 81,080 81,860 83,190 101,700 101,380
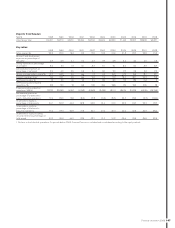
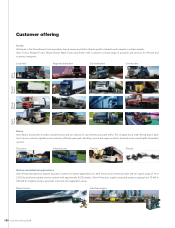
Delivered units
Number 1998 1999 2000 2001 2002 2003 2004 2005 2006 2007 2008
Heavy trucks (>16 tons) 78,690 81,240 76,470 117,180 120,200 120,920 152,300 172,242 179,089 172,322 179,962
Medium-heavy trucks (7–15.9 tons) 4,590 3,850 5,360 17,310 16,220 15,870 18,800 18,643 14,695 27,933 30,817
Light trucks (<7 tons) – ––20,820 20,710 19,200 22,120 23,494 26,147 36,101 40,372
Total trucks 83,280 85,090 81,830 155,310 157,130 155,990 193,220 214,379 219,931 236,356 251,151
Buses and bus chassis 10,200 9,500 11,015 9,953 9,059 7,817 8,232 10,675 10,360 9,916 9,937
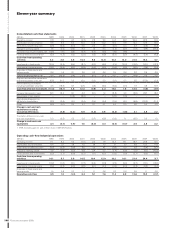
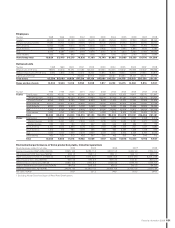
Environmental performance of Volvo production plants, Industrial operations
Absolute values related to net sales 2004 2005 2006 200712008
Energy consumption (GWh; MWh/SEK M) 2,695; 13.3 2,683; 11.6 2,612; 10.5 2,426; 9.6 2,754; 9.3
CO2 emissions (1,000 tons; tons/SEK M) 293; 1.5 292; 1.3 282; 1.1 242; 1.0 339; 1.2
Water consumption (1,000 m3; m3/SEK M) 8,495; 42.2 7,419; 32.1 7,596; 30.6 7,067; 27.9 8,205; 27.8
NOx emissions (tons; kilos/SEK M) 645; 3.2 672; 2.9 606; 2.4 542; 2.1 800; 2.7
Solvent emissions (tons; kilos/SEK M) 2,085; 10.3 1,960; 8.5 2,048; 8.3 1,979; 7.8 1,945; 6.6
Sulphur dioxide emissions (tons; kilos/SEK M) 184; 0.9 209; 0.9 69; 0.3 58; 0.2 64; 0.2
Hazardous waste (tons; kg/SEK M) 24,675; 122 23,590; 102 26,987; 109 27,120; 107 27,675; 94
Net sales, SEK bn 202.1 231.2 248.1 253.2 294.9
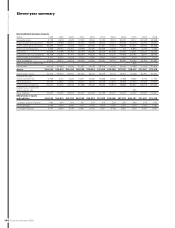
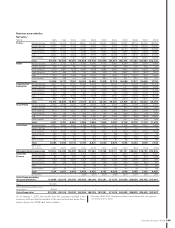
Number 1998 1999 2000 2001 2002 2003 2004 2005 2006 2007 2008
Trucks Total Europe 42,350 42,530 46,140 98,040 96,290 92,080 102,670 103,622 114,417 128,070 121,847
Western Europe 37,810 39,630 42,050 90,460 87,490 82,670 90,750 91,087 97,074 100,106 95,969
Eastern Europe 4,540 2,900 4,090 7,580 8,800 9,410 11,920 12,535 17,343 27,964 25,878
North America 29,310 34,300 23,610 34,650 36,510 34,760 49,270 64,974 70,499 33,280 30,146
South America 6,020 3,900 4,530 5,790 5,360 5,980 9,190 11,248 11,646 15,264 18,092
Asia 3,760 2,720 5,560 6,600 9,140 16,290 24,880 25,706 12,817 39,916 60,725
Other markets 1,840 1,640 1,990 10,230 9,830 6,880 7,210 8,829 10,552 19,826 20,341
Total 83,280 85,090 81,830 155,310 157,130 155,990 193,220 214,379 219,931 236,356 251,151
Buses Total Europe 3,860 3,630 3,994 3,115 3,413 3,087 3,417 3,723 3,570 3,748 3,313
Western Europe 3,580 3,430 3,870 2,899 3,076 2,782 3,073 3,385 3,081 3,377 3,140
Eastern Europe 280 200 124 216 337 305 344 338 489 371 173
North America 2,730 3,640 3,869 3,128 1,945 1,553 1,388 1,546 1,741 1,547 1,884
South America 1,510 710 980 1,009 495 369 624 2,297 1,236 1,318 995
Asia 1,650 1,000 1,659 2,209 2,639 2,227 2,341 2,554 3,349 2,757 3,033
Other markets 450 520 513 492 567 581 462 555 464 546 712
Total 10,200 9,500 11,015 9,953 9,059 7,817 8,232 10,675 10,360 9,916 9,937
1 Excluding Nissan Diesel and Ingersoll Rand Road Development.