Volvo 2008 Annual Report Download - page 113
Download and view the complete annual report
Please find page 113 of the 2008 Volvo annual report below. You can navigate through the pages in the report by either clicking on the pages listed below, or by using the keyword search tool below to find specific information within the annual report.-
 1
1 -
2
-
3
-
4
-
5
-
6
-
7
-
8
-
9
-
10
-
11
-
12
-
13
-
14
-
15
-
16
-
17
-
18
-
19
-
20
-
21
-
22
-
23
-
24
-
25
-
26
-
27
-
28
-
29
-
30
-
31
-
32
-
33
-
34
-
35
-
36
-
37
-
38
-
39
-
40
-
41
-
42
-
43
-
44
-
45
-
46
-
47
-
48
-
49
-
50
-
51
-
52
-
53
-
54
-
55
-
56
-
57
-
58
-
59
-
60
-
61
-
62
-
63
-
64
-
65
-
66
-
67
-
68
-
69
-
70
-
71
-
72
-
73
-
74
-
75
-
76
-
77
-
78
-
79
-
80
-
81
-
82
-
83
-
84
-
85
-
86
-
87
-
88
-
89
-
90
-
91
-
92
-
93
-
94
-
95
-
96
-
97
-
98
-
99
-
100
-
101
-
102
-
 103
103 -
 104
104 -
 105
105 -
 106
106 -
 107
107 -
 108
108 -
 109
109 -
 110
110 -
 111
111 -
 112
112 -
 113
113 -
 114
114 -
 115
115 -
 116
116 -
 117
117 -
 118
118 -
 119
119 -
 120
120 -
 121
121 -
 122
122 -
 123
123 -
124
-
125
-
126
-
127
-
128
-
129
-
130
-
131
-
132
-
133
-
134
-
135
-
136
-
137
-
138
-
139
-
140
-
141
-
142
-
143
-
144
-
145
-
146
-
147
-
148
-
149
-
150
-
151
-
152
-
153
-
154
-
155
-
156
-
157
-
158
-
159
-
160
 |
 |

109
Financial information 2008
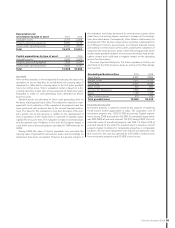
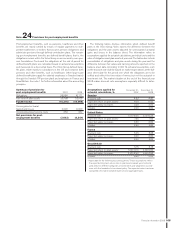
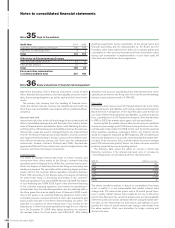
Volvo’s pension foundation in Sweden was formed in 1996 to secure
obligations relating to retirement pensions for salaried employees in
Sweden in accordance with the ITP plan (a Swedish individual pension
plan). Plan assets amounting to 2,456 was contributed to the founda-
tion at its formation, corresponding to the value of the pension obliga-
tions at that time. Since its formation, net contributions of 1,472 have
been made to the foundation. The plan assets in Volvo’s Swedish pen-
sion foundation are invested in Swedish and foreign stocks and mutual
funds, and in interest-bearing securities, in accordance with a distri-
bution that is determined by the foundation’s Board of Directors. At
December 31, 2008, the fair value of the foundation’s plan assets
amounted to 5,467 (6,648), of which 35% (43) was invested in shares
or mutual funds. At the same date, retirement pension obligations
attributable to the ITP plan amounted to 8,675 (7,847). In the valu-
ation of Volvo’s pension liability for the Swedish companies, the life-
expectancy assumptions was changed during 2007. Men are now
assumed to live about two years longer than previously. The increase
for women is about one year. The changed life-expectancy assump-
tions increased the pension obligation by about 14% 2007. However,
this increase did not immediately affected the carrying amount of the
Volvo Group’s liabilities for 2007 since Volvo applies the corridor
approach to actuarial gains and losses. Swedish companies can
secure new pension obligations through balance sheet provisions or
pension fund contributions. Furthermore, a credit insurance must be
taken for the value of the obligations. In addition to benefi ts relating to
retirement pensions, the ITP plan also includes, for example, a collec-
tive family pension, which Volvo fi nances through insurance with the
Alecta insurance company. According to an interpretation from the
Swedish Financial Reporting Board, this is a multi-employer defi ned
benefi t plan. For fi scal year 2008, Volvo did not have access to infor-
mation from Alecta that would have enabled this plan to be reported
as a defi ned benefi t plan. Accordingly, the plan has been reported as
a defi ned contribution plan. Alecta’s funding ratio is 112% (152.0).
Alecta’s current funding ratio is below the target of 140%.
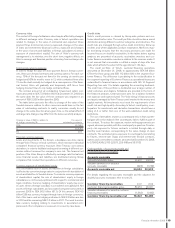
Volvo’s subsidiaries in the United States mainly secure their pen-
sion obligations through transfer of funds to pension plans. At the end
of 2008, the total value of pension obligations secured by pension
plans of this type amounted to 13,322 (10,928). At the same point in
time, the total value of the plan assets in these plans amounted to
10,672 (12,195), of which 50% (58) was invested in shares or mutual
funds. The regulations for securing pension obligations stipulate cer-
tain minimum levels concerning the ratio between the value of the
plan assets and the value of the obligations. During 2008, Volvo con-
tributed 0 (0) to the pension plans.
During 2008 Volvo has made extra contributions to the pension-
plans in Great Britain in the amount of 147 (135).
In 2009, Volvo estimate to transfer an amount of not more than
SEK 1 billion to pension plans.
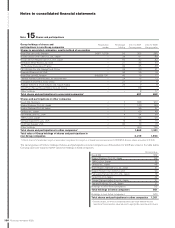
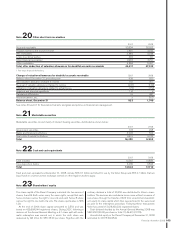
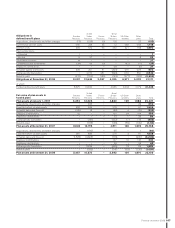
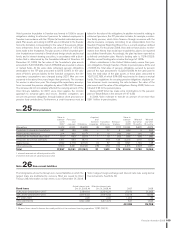
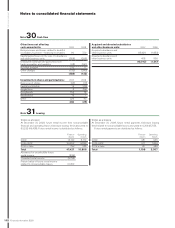
Note 25 Other provisions
Value in
balance
sheet
2007
Provisions
and
reversals Utilizations
Acquired
and
divested
companies
Translation
differences
Reclassi-
fi cations
Value in
balance
sheet
2008
Whereof
due within
12 months
Whereof
due after
12 months
Warranties 9,373 6,201 (5,982) 45 828 (111) 10,354 5,681 4,673
Provisions in insurance operations 387 135 (98) – 77 8 509 9 500
Restructuring measures1214 360 (207) 5 15 (19) 368 280 88
Provisions for residual value risks2670 483 (321) – 76 (10) 898 356 542
Provisions for service contracts 1,911 943 (827) – 114 134 2,275 1,147 1,128
Dealer bonus 1,802 2,778 (2,791) (1) 87 22 1,897 1,749 148
Other provisions 3,600 3,461 (3,034) (18) 354 152 4,515 2,528 1,987
Total 17,957 14,361 (13,260) 31 1,551 176 20,816 11,750 9,066
1 whereof reversed not utilized provisions 65.
2 whereof reversed not utilized provisions 52.
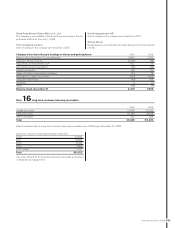
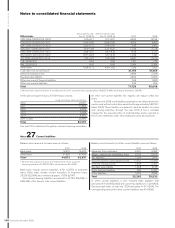
Note 26 Non-current liabilities
The listing below shows the Group’s non-current liabilities in which the
largest loans are distributed by currency. Most are issued by Volvo
Treasury AB. Information on loan terms is as of December 31, 2008.
Volvo hedges foreign-exchange and interest-rate risks using deriva-
tive instruments. See Note 36.
Bond loans Actual interest rate,
Dec 31, 2008, %
Effective interest rate,
Dec 31, 2008, % 2007 2008
EUR 2002–2008/2010–2017 3.18–6.14 3.22–6,23 27,070 21,903
SEK 2006–2008/2010–2017 3.59–6.33 3.64–6.43 13,378 12,183
JPY 2001/2011 2.90 2.90 1,203 86
USD 2007/2010 3.62–4.68 3.67–4.73 647 1,626
Total1 42,298 35,798
1 Whereof loans raised to fi nance the credit portfolio of the customer fi nancing operations 17,787 (26,311).