Volvo 2008 Annual Report Download - page 48
Download and view the complete annual report
Please find page 48 of the 2008 Volvo annual report below. You can navigate through the pages in the report by either clicking on the pages listed below, or by using the keyword search tool below to find specific information within the annual report.-
 1
1 -
2
-
3
-
4
-
5
-
6
-
7
-
8
-
9
-
10
-
11
-
12
-
13
-
14
-
15
-
16
-
17
-
18
-
19
-
20
-
21
-
22
-
23
-
24
-
25
-
26
-
27
-
28
-
29
-
30
-
31
-
32
-
33
-
34
-
35
-
36
-
37
-
 38
38 -
 39
39 -
 40
40 -
 41
41 -
 42
42 -
 43
43 -
 44
44 -
 45
45 -
 46
46 -
 47
47 -
 48
48 -
 49
49 -
 50
50 -
 51
51 -
 52
52 -
 53
53 -
 54
54 -
 55
55 -
 56
56 -
 57
57 -
 58
58 -
59
-
60
-
61
-
62
-
63
-
64
-
65
-
66
-
67
-
68
-
69
-
70
-
71
-
72
-
73
-
74
-
75
-
76
-
77
-
78
-
79
-
80
-
81
-
82
-
83
-
84
-
85
-
86
-
87
-
88
-
89
-
90
-
91
-
92
-
93
-
94
-
95
-
96
-
97
-
98
-
99
-
100
-
101
-
102
-
103
-
104
-
105
-
106
-
107
-
108
-
109
-
110
-
111
-
112
-
113
-
114
-
115
-
116
-
117
-
118
-
119
-
120
-
121
-
122
-
123
-
124
-
125
-
126
-
127
-
128
-
129
-
130
-
131
-
132
-
133
-
134
-
135
-
136
-
137
-
138
-
139
-
140
-
141
-
142
-
143
-
144
-
145
-
146
-
147
-
148
-
149
-
150
-
151
-
152
-
153
-
154
-
155
-
156
-
157
-
158
-
159
-
160
 |
 |
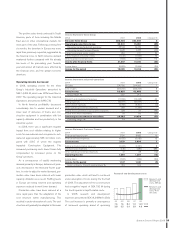
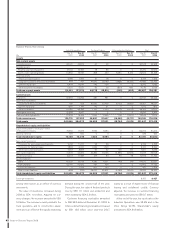
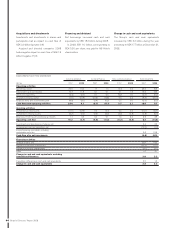
Consolidated cash-fl ow statements
Industrial operations Customer Finance Elim. and reclassifi cations Volvo Group Total
SEK bn 2007 2008 2007 2008 2007 2008 2007 2008
Operating activities
Operating income 20.6 14.5 1.7 1.4 (0.1) 0.0 22.2 15.9
Depreciation and amortization 10.3 11.8 0.1 0.1 2.1 1.6 12.5 13.5
Other non-cash items (0.4) (0.7) 0.1 0.4 (0.2) 0.1 (0.5) (0.2)
Change in working capital (0.1) (10.9) (10.2) (12.8) 0.4 0.4 (9.9) (23.3)
Financial items and income taxes paid (6.0) (5.0) (0.4) (0.2) 0.5 0.0 (5.9) (5.2)
Cash fl ow from operating activities 24.4 9.7 (8.7) (11.1) 2.7 2.1 18.4 0.7
Investing activities
Investments in fi xed assets (10.1) (12.6) 0.0 (0.1) 0.0 0.0 (10.1) (12.7)
Investment in leasing assets (0.2) (0.4) (0.3) (0.2) (4.3) (4.8) (4.8) (5.4)
Disposals of fi xed assets and leasing vehicles 1.1 0.6 0.4 0.1 1.4 2.2 2.9 2.9
Operating cash fl ow 15.2 (2.7) (8.6) (11.3) (0.2) (0.5) 6.4 (14.5)
Investments and divestments of shares, net 0.4 0.0
Acquired and divested operations, net (15.0) (1.3)
Interest-bearing receivables including
marketable securites 3.6 10.9
Cash-fl ow after net investments (4.6) (4.9)
Financing activities
Change in loans, net 28.7 18.2
Payment to AB Volvo shareholders (20.3) (11.1)
Payment to minority shareholders (0.1) (0.1)
Other 0.1 0.1
Change in cash and cash equivalents excluding
translation differences 3.8 2.2
Translation difference on cash and cash equivalents 0.0 1.0
Change in cash and cash equivalents 3.8 3.2
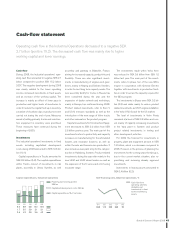
Acquisitions and divestments
Investments and divestments in shares and
participation had an impact on cash fl ow of
SEK 0.0 billion (positive 0.4).
Acquired and divested companies 2008
had a negative impact on cash fl ow of SEK 1.3
billion (negative 15.0).
Financing and dividend
Net borrowings increased cash and cash
equivalents by SEK 18.2 billion during 2008.
In 2008, SEK 11.1 billion, corresponding to
SEK 5.50 per share, was paid to AB Volvo's
shareholders.
Change in cash and cash equivalents
The Group’s cash and cash equivalents
increased by SEK 3.2 billion during the year
amounting to SEK 17.7 billion at December 31,
2008.
44 Board of Directors’ Report 2008