Volvo 2008 Annual Report Download - page 125
Download and view the complete annual report
Please find page 125 of the 2008 Volvo annual report below. You can navigate through the pages in the report by either clicking on the pages listed below, or by using the keyword search tool below to find specific information within the annual report.-
 1
1 -
2
-
3
-
4
-
5
-
6
-
7
-
8
-
9
-
10
-
11
-
12
-
13
-
14
-
15
-
16
-
17
-
18
-
19
-
20
-
21
-
22
-
23
-
24
-
25
-
26
-
27
-
28
-
29
-
30
-
31
-
32
-
33
-
34
-
35
-
36
-
37
-
38
-
39
-
40
-
41
-
42
-
43
-
44
-
45
-
46
-
47
-
48
-
49
-
50
-
51
-
52
-
53
-
54
-
55
-
56
-
57
-
58
-
59
-
60
-
61
-
62
-
63
-
64
-
65
-
66
-
67
-
68
-
69
-
70
-
71
-
72
-
73
-
74
-
75
-
76
-
77
-
78
-
79
-
80
-
81
-
82
-
83
-
84
-
85
-
86
-
87
-
88
-
89
-
90
-
91
-
92
-
93
-
94
-
95
-
96
-
97
-
98
-
99
-
100
-
101
-
102
-
103
-
104
-
105
-
106
-
107
-
108
-
109
-
110
-
111
-
112
-
113
-
114
-
 115
115 -
 116
116 -
 117
117 -
 118
118 -
 119
119 -
 120
120 -
 121
121 -
 122
122 -
 123
123 -
 124
124 -
 125
125 -
 126
126 -
 127
127 -
 128
128 -
 129
129 -
 130
130 -
 131
131 -
 132
132 -
 133
133 -
 134
134 -
 135
135 -
136
-
137
-
138
-
139
-
140
-
141
-
142
-
143
-
144
-
145
-
146
-
147
-
148
-
149
-
150
-
151
-
152
-
153
-
154
-
155
-
156
-
157
-
158
-
159
-
160
 |
 |

121
Financial information 2008
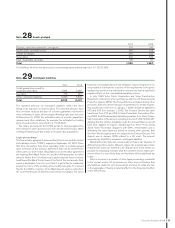
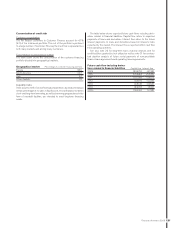
Concentration of credit risk
Customer concentration
The ten largest customers in Customer Finance account for 4.7%
(4.7) of the total asset portfolio. The rest of the portfolio is pertinent
to a large number of customer. This way the credit risk is spread across
both many markets and among many customers.
Concentration by geographical market
The table below shows the concentration of the customer fi nancing
portfolio divided into geographical markets.
Geographical market Percentage of customer fi nancing portfolio
Europe 56.9
North America 29.7
Asia 6.1
Other markets 7.3
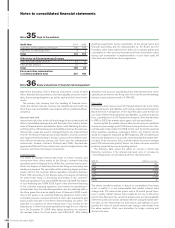
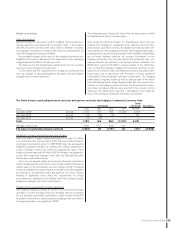
Liquidity risks
Volvo assures itself of sound fi nancial preparedness by always keeping a
certain percentage of its sales in liquid assets. A sound balance between
short- and long-term borrowing, as well as borrowing preparedness in the
form of overdraft facilities, are intended to meet long-term fi nancing
needs.
The table below shows expected future cash-fl ows including deriv-
atives related to fi nancial liabilities. Capital fl ow refers to expected
payments of loans and derivatives. Interest fl ow refers to the future
interest payments on loans and derivatives based on interests rates
expected by the market. The interest fl ow is reported within cash fl ow
from operating activities.
See also note 26 for long-term loans maturity analysis and for
credit facilities granted but not utilized as well as note 31 for contrac-
tual duration analysis of future rental payments of noncancellable
fi nance lease agreements and operating lease agreements.
Future cash-fl ow including deriva-
tives related to fi nancial liabilities Capital fl ow Interest fl ow
2009 (60,475) (4,735)
2010 (23,946) (2,533)
2011 (19,318) (1,827)
2012 (6,691) (1,325)
2013 (9,804) (1,094)
2014 (4,922) (832)
2015– (19,335) (1,768)