Volvo 2008 Annual Report Download - page 151
Download and view the complete annual report
Please find page 151 of the 2008 Volvo annual report below. You can navigate through the pages in the report by either clicking on the pages listed below, or by using the keyword search tool below to find specific information within the annual report.-
 1
1 -
2
-
3
-
4
-
5
-
6
-
7
-
8
-
9
-
10
-
11
-
12
-
13
-
14
-
15
-
16
-
17
-
18
-
19
-
20
-
21
-
22
-
23
-
24
-
25
-
26
-
27
-
28
-
29
-
30
-
31
-
32
-
33
-
34
-
35
-
36
-
37
-
38
-
39
-
40
-
41
-
42
-
43
-
44
-
45
-
46
-
47
-
48
-
49
-
50
-
51
-
52
-
53
-
54
-
55
-
56
-
57
-
58
-
59
-
60
-
61
-
62
-
63
-
64
-
65
-
66
-
67
-
68
-
69
-
70
-
71
-
72
-
73
-
74
-
75
-
76
-
77
-
78
-
79
-
80
-
81
-
82
-
83
-
84
-
85
-
86
-
87
-
88
-
89
-
90
-
91
-
92
-
93
-
94
-
95
-
96
-
97
-
98
-
99
-
100
-
101
-
102
-
103
-
104
-
105
-
106
-
107
-
108
-
109
-
110
-
111
-
112
-
113
-
114
-
115
-
116
-
117
-
118
-
119
-
120
-
121
-
122
-
123
-
124
-
125
-
126
-
127
-
128
-
129
-
130
-
131
-
132
-
133
-
134
-
135
-
136
-
137
-
138
-
139
-
140
-
 141
141 -
 142
142 -
 143
143 -
 144
144 -
 145
145 -
 146
146 -
 147
147 -
 148
148 -
 149
149 -
 150
150 -
 151
151 -
 152
152 -
 153
153 -
 154
154 -
 155
155 -
 156
156 -
 157
157 -
 158
158 -
 159
159 -
 160
160
 |
 |

147
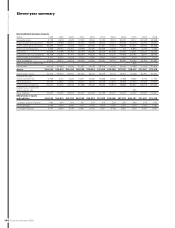
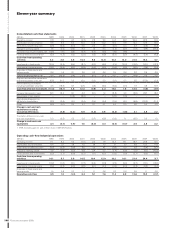
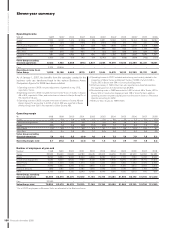
Financial information 2008
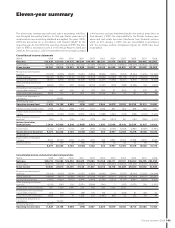
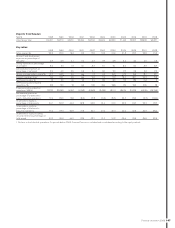
Key ratios
1998 1999 2000 2001 2002 2003 2004 2005 2006 2007 2008
Gross margin, %123.2 20.3 19.3 17.2 17.9 19.2 21.6 21.8 22.7 22.6 21.3
Research and development
expenses as percentage of
net sales14.9 3.9 4.1 3.0 3.3 3.9 3.8 3.3 3.4 4.0 4.9
Selling expenses as percentage
of net sales19.0 7.0 7.7 8.1 8.7 9.1 9.1 8.5 8.0 8.9 8.7
Administration expenses as
percentage of net sales13.9 4.0 3.9 3.6 3.1 3.0 2.6 2.7 2.6 2.6 2.3
Return on shareholders’ equity, % 13.0 34.9 5.0 neg 1.7 0.4 13.9 17.8 19.6 18.1 12.1
Interest coverage, times19.6 23.1 4.5 neg 2.2 1.9 11.0 16.7 26.1 20.7 8.8
Self-fi nancing ratio, % 16 29 39 92 110 152 163 116 189 153 5
Self-fi nancing ratio Industrial
operations, % 105 130 72 148 196 243 268 173 235 265 78
Financial position, Industrial
operations, SEK M 12,232 28,758 9,392 (7,042) (6,063) (2,426) 18,110 18,675 23,076 (4,305) (29,795)
Net fi nancial position as
percentage of shareholders'
equity , Industrial operations 17.4 29.3 10.6 (8.2) (7.7) (3.3) 25.8 23.7 29.2 (5.7) (39.4)
Shareholders’ equity as
percentage of total assets 34.1 50.2 44.3 32.8 32.8 31.4 31.3 30.6 33.7 25.7 22.7
Shareholders’ equity as
percentage of total assets,
Industrial operations 51.2 67.3 60.8 41.8 42.4 40.5 40.0 40.4 40.6 30.8 28.4
Shareholders’ equity excluding
minority interest as percentage of
total assets 33.7 49.9 44.0 32.6 32.7 31.3 31.2 30.5 33.6 25.6 22.6
1 Pertains to the Industrial operations. For periods before 2006, Financial Services is included and consolidated according to the equity method.
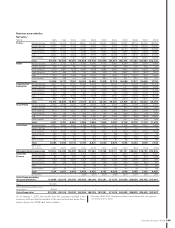
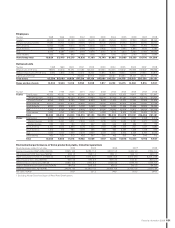
Exports from Sweden
SEK M 1998 1999 2000 2001 2002 2003 2004 2005 2006 2007 2008
Volvo Group, total 64,401 52,719 46,251 50,394 52,730 49,300 62,653 71,133 80,517 88,606 96,571