Volvo 2008 Annual Report Download - page 43
Download and view the complete annual report
Please find page 43 of the 2008 Volvo annual report below. You can navigate through the pages in the report by either clicking on the pages listed below, or by using the keyword search tool below to find specific information within the annual report.-
 1
1 -
2
-
3
-
4
-
5
-
6
-
7
-
8
-
9
-
10
-
11
-
12
-
13
-
14
-
15
-
16
-
17
-
18
-
19
-
20
-
21
-
22
-
23
-
24
-
25
-
26
-
27
-
28
-
29
-
30
-
31
-
32
-
 33
33 -
 34
34 -
 35
35 -
 36
36 -
 37
37 -
 38
38 -
 39
39 -
 40
40 -
 41
41 -
 42
42 -
 43
43 -
 44
44 -
 45
45 -
 46
46 -
 47
47 -
 48
48 -
 49
49 -
 50
50 -
 51
51 -
 52
52 -
 53
53 -
54
-
55
-
56
-
57
-
58
-
59
-
60
-
61
-
62
-
63
-
64
-
65
-
66
-
67
-
68
-
69
-
70
-
71
-
72
-
73
-
74
-
75
-
76
-
77
-
78
-
79
-
80
-
81
-
82
-
83
-
84
-
85
-
86
-
87
-
88
-
89
-
90
-
91
-
92
-
93
-
94
-
95
-
96
-
97
-
98
-
99
-
100
-
101
-
102
-
103
-
104
-
105
-
106
-
107
-
108
-
109
-
110
-
111
-
112
-
113
-
114
-
115
-
116
-
117
-
118
-
119
-
120
-
121
-
122
-
123
-
124
-
125
-
126
-
127
-
128
-
129
-
130
-
131
-
132
-
133
-
134
-
135
-
136
-
137
-
138
-
139
-
140
-
141
-
142
-
143
-
144
-
145
-
146
-
147
-
148
-
149
-
150
-
151
-
152
-
153
-
154
-
155
-
156
-
157
-
158
-
159
-
160
 |
 |

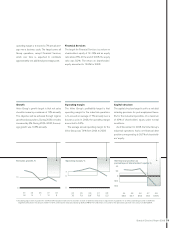
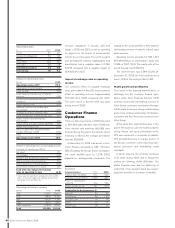
The positive sales trend continued In South
America, parts of Asia including the Middle
East and on other international markets for
most part of the year. Following a strong fi rst
six months, the downturn in Europe was more
rapid than previously expected, aggravated by
the fi nancial crisis. In North America demand
weakened further compared with the already
low levels of the preceeding year. Towards
year-end almost all markets were affected by
the fi nancial crisis and the global economic
downturn.
Operating income decreased
In 2008, operating income for the Volvo
Group’s Industrial Operations amounted to
SEK 14,454 M, which was 30% lower than in
2007. The operating margin for the Industrial
Operations amounted to 4.9% (7.4).
In North America profi tability decreased
considerably due to weaker demand and a
lower level of deliveries of trucks and con-
struction equipment in combination with low
capacity utilization and low productivity in the
industrial system.
In 2008, there was a signifi cant negative
impact from cost infl ation relating to higher
costs for raw materials and components, esti-
mated at approximately SEK 2.2 billion com-
pared with 2007, of which the majority
impacted Construction Equipment. The
increased purchasing costs haven’t been fully
compensated by increased prices on the
Group’s products.
As a consequence of rapidly weakening
demand primarily in Europe, deliveries of prod-
ucts decreased in the third and fourth quar-
ters. In order to adjust to market demand, pro-
duction rates have been reduced with lower
capacity utilization as a result. Staffi ng levels
in Europe are being lowered and operating
expenses reduced to meet lower demand.
Production rates have been reduced at a
more rapid pace than the adaptation of the
cost structure within manufacturing. This
resulted in under-absorption of costs. The cost
structure will gradually be adapted to the lower
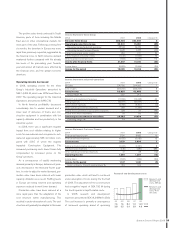
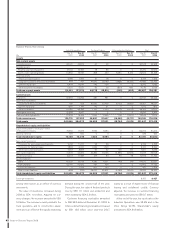
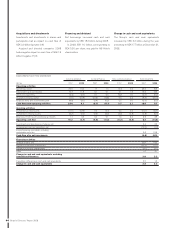
Income Statement Volvo Group
SEK M 2007 2008 Change in %
Net sales Volvo Group 285,405 303,667 6
Operating Income Volvo Group 22,231 15,851 (29)
Operating income Industrial operations 20,583 14,454 (30)
Operating income Customer Finance 1,649 1,397 (15)
Interest income and similar credits 952 1,171 23
Interest expense and similar credits (1,122) (1,935) 72
Other fi nancial income and costs (504) (1,077) 114
Income after fi nancial items 21,557 14,010 (35)
Income taxes (6,529) (3,994) (39)
Income for the period 15,028 10,016 (33)
Income Statement Industrial operations
SEK M 2007 2008 Change in %
Net sales 276,795 294,932 7
Cost of sales (214,160) (232,247) 8
Gross income 62,635 62,685 0
Gross margin, % 22.6 21.3
Research and development expenses (11,059) (14,348) 30
Selling expenses (24,671) (25,597) 4
Administrative expenses (7,092) (6,921) (2)
Other operating income and expenses 249 (1,457) –
Income from investments in associated companies 428 23 (95)
Income from other investments 93 69 (26)
Operating income Industrial operations 20,583 14,454 (30)
Operating margin, % 7.4 4.9
Income Statement Customer Finance
SEK M 2007 2008 Change in %
Finance and lease income 7,705 8,485 10
Finance and lease expenses (4,535) (5,082) 12
Gross income 3,170 3,403 7
Selling and administrative expenses (1,437) (1,551) 8
Credit provision expenses (125) (483) 286
Other operating income and expenses 41 28 (32)
Operating income 1,649 1,397 (15)
Income taxes (502) (356) (29)
Income for the period 1,147 1,041 (9)
Return on Equity, 12 month moving values, % 15.9 12.6
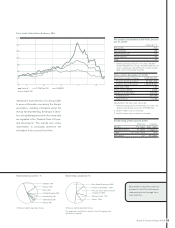
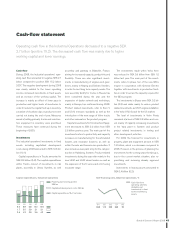
Research and development costs
0807060504
14.311.18.47.67.6
4.93.93.43.33.8
Research and
development
costs, SEK bn
Research and
development
costs, % of
net sales
production rates which will lead to continued
under absorption of costs during the fi rst half
of 2009. The adjustment of the cost structure
had a negative impact of SEK 750 M during
the fourth quarter in layoff-related costs.
In 2008, research and development
expenses amounted to SEK 14,348 M (11,059).
The cost increase is primarily a consequence
of increased spending ahead of upcoming
39
Board of Directors’ Report 2008