Volvo 2008 Annual Report Download - page 154
Download and view the complete annual report
Please find page 154 of the 2008 Volvo annual report below. You can navigate through the pages in the report by either clicking on the pages listed below, or by using the keyword search tool below to find specific information within the annual report.-
 1
1 -
2
-
3
-
4
-
5
-
6
-
7
-
8
-
9
-
10
-
11
-
12
-
13
-
14
-
15
-
16
-
17
-
18
-
19
-
20
-
21
-
22
-
23
-
24
-
25
-
26
-
27
-
28
-
29
-
30
-
31
-
32
-
33
-
34
-
35
-
36
-
37
-
38
-
39
-
40
-
41
-
42
-
43
-
44
-
45
-
46
-
47
-
48
-
49
-
50
-
51
-
52
-
53
-
54
-
55
-
56
-
57
-
58
-
59
-
60
-
61
-
62
-
63
-
64
-
65
-
66
-
67
-
68
-
69
-
70
-
71
-
72
-
73
-
74
-
75
-
76
-
77
-
78
-
79
-
80
-
81
-
82
-
83
-
84
-
85
-
86
-
87
-
88
-
89
-
90
-
91
-
92
-
93
-
94
-
95
-
96
-
97
-
98
-
99
-
100
-
101
-
102
-
103
-
104
-
105
-
106
-
107
-
108
-
109
-
110
-
111
-
112
-
113
-
114
-
115
-
116
-
117
-
118
-
119
-
120
-
121
-
122
-
123
-
124
-
125
-
126
-
127
-
128
-
129
-
130
-
131
-
132
-
133
-
134
-
135
-
136
-
137
-
138
-
139
-
140
-
141
-
142
-
143
-
 144
144 -
 145
145 -
 146
146 -
 147
147 -
 148
148 -
 149
149 -
 150
150 -
 151
151 -
 152
152 -
 153
153 -
 154
154 -
 155
155 -
 156
156 -
 157
157 -
 158
158 -
 159
159 -
 160
160
 |
 |

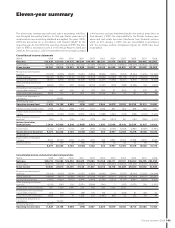
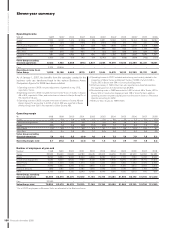
Eleven-year summary
150
ELEVEN-YEAR SUMMARY
Financial information 2008
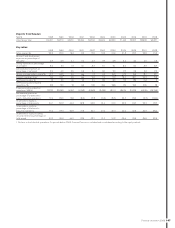
Operating income
SEK M 19986199952000 200142002 20033200422005 200612007 2008
Trucks72,769 3,247 1,414 (2,066) 1,189 3,951 8,992 11,717 13,116 15,193 12,167
Buses (37) 224 440 (916) (94) (790) 158 470 745 231 (76)
Construction Equipment 626 1,709 1,594 527 406 908 1,898 2,752 4,072 4,218 1,808
Volvo Penta (63) 314 484 658 647 695 940 943 1,105 1,173 928
Volvo Aero 527 584 621 653 5 (44) 403 836 359 529 359
Customer Finance 681 1,066 1,499 325 490 926 1,365 2,033 1,686 1,649 1,397
Other 3,950 319 616 143 194 (3,142) 923 (598) (684) (762) (731)
Volvo Group excluding
divested operations 8,453 7,463 6,668 (676) 2,837 2,504 14,679 18,153 20,399 22,231 15,851
Cars 3,375 26,695 –––––––––
Operating income (loss)
Volvo Group 11,828 34,158 6,668 (676) 2,837 2,504 14,679 18,153 20,399 22,231 15,851
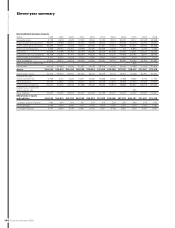
Operating margin
% 1998 1999 2000 2001 2002 2003 2004 2005 2006 2007 2008
Trucks 5.0 5.4 2.4 (1.8) 1.0 3.4 6.6 7.5 7.7 8.1 6.0
Construction Equipment 3.2 9.1 8.0 2.5 1.9 3.9 6.5 7.9 9.7 7.9 3.2
Buses (0.3) 1.5 2.6 (5.5) (0.7) (6.6) 1.2 2.8 4.3 1.4 (0.4)
Volvo Penta (1.3) 5.5 7.3 8.9 8.4 9.1 10.4 9.6 10.3 10.0 8.1
Volvo Aero 6.1 5.9 5.8 5.5 0.1 (0.5) 5.8 11.1 4.4 6.9 4.8
Volvo Group excluding
divested operations 7.9 6.4 5.5 (0.4) 1.6 1.4 7.3 7.9 7.9 7.8 5.2
Operating margin, total 5.7 29.3 5.5 (0.4) 1.6 1.4 7.3 7.9 7.9 7.8 5.2
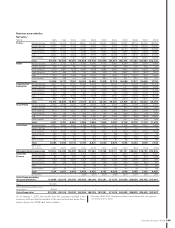
Number of employees at year-end
Number11998 1999 2000 2001 2002 2003 2004 2005 2006 2007 2008
Trucks 22,560 23,330 24,320 44,180 43,470 46,900 49,450 50,240 49,900 64,390 64,280
Buses 8,690 8,860 9,060 6,230 6,660 6,680 7,700 7,710 7,760 9,290 8,930
Construction Equipment 9,680 8,900 8,830 7,780 8,410 9,280 9,930 10,290 11,050 19,710 19,810
Volvo Penta 1,490 1,400 1,480 1,370 1,410 1,440 1,580 1,560 1,650 3,000 2,940
Volvo Aero 3,990 4,550 4,240 4,040 3,660 3,440 3,350 3,460 3,510 3,550 3,510
Financial Services 860 1,160 1,220 1,080 1,060 1,060 1,100 1,070 1,010 1,150 1,290
Other 5,190 5,270 5,120 6,240 6,490 6,940 7,970 7,530 8,310 610 620
Volvo Group, excluding
divested operations 52,460 53,470 54,270 70,920 71,160 75,740 81,080 81,860 83,190 101,700 101,380
Cars 27,360 ––––––––––
Volvo Group, total 79,820 53,470 54,270 70,920 71,160 75,740 81,080 81,860 83,190 101,700 101,380
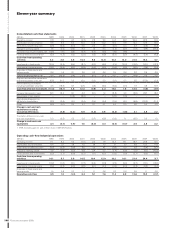
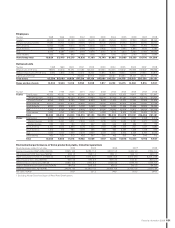
As of January 1, 2007, the benefi ts from the synergies created in the
business units are transferred back to the various Business Areas.
Comparison fi gures for 2006 have been restated.
1 Operating income in 2006 includes adjustment of goodwill of neg 1,712,
reported in Trucks.
2 Operating income in 2004 included reversal of write-down of shares in Scania
AB of 915, reported in Other, and write-down of shares in Henlys Group Plc of
95, reported in Buses.
3 Operating income in 2003 included write-down of shares in Scania AB and
Henlys Group Plc amounting to 4,030, of which 429 was reported in Buses
(Henlys Group) and 3,601 was reported in Other (Scania AB).
4 Operating income in 2001 included restructuring costs mainly related to the
integration of Mack Trucks and Renault Trucks of 3,862 of which 3,106 in
Trucks, 392 in Buses and 364 in Construction Equipment.
5 Effective January 1, 1999, Volvo Cars was reported as a divested operation.
The capital gain from the divestment was 26,695.
6 Restructuring costs in 1998 amounted to 1,650 of which 46 in Trucks, 422 in
Buses, 910 in Construction Equipment and 158 in Volvo Penta. In addition
operating income included a capital gain from the sale of shares in Pharmacia
UpJohn amounting to 4,452.
7 Refers to Volvo Trucks for 1998–2000.
1 As of 2007, employees on Business Units are allocated to the Business Areas.