Volvo 2008 Annual Report Download - page 55
Download and view the complete annual report
Please find page 55 of the 2008 Volvo annual report below. You can navigate through the pages in the report by either clicking on the pages listed below, or by using the keyword search tool below to find specific information within the annual report.-
 1
1 -
2
-
3
-
4
-
5
-
6
-
7
-
8
-
9
-
10
-
11
-
12
-
13
-
14
-
15
-
16
-
17
-
18
-
19
-
20
-
21
-
22
-
23
-
24
-
25
-
26
-
27
-
28
-
29
-
30
-
31
-
32
-
33
-
34
-
35
-
36
-
37
-
38
-
39
-
40
-
41
-
42
-
43
-
44
-
 45
45 -
 46
46 -
 47
47 -
 48
48 -
 49
49 -
 50
50 -
 51
51 -
 52
52 -
 53
53 -
 54
54 -
 55
55 -
 56
56 -
 57
57 -
 58
58 -
 59
59 -
 60
60 -
 61
61 -
 62
62 -
 63
63 -
 64
64 -
 65
65 -
66
-
67
-
68
-
69
-
70
-
71
-
72
-
73
-
74
-
75
-
76
-
77
-
78
-
79
-
80
-
81
-
82
-
83
-
84
-
85
-
86
-
87
-
88
-
89
-
90
-
91
-
92
-
93
-
94
-
95
-
96
-
97
-
98
-
99
-
100
-
101
-
102
-
103
-
104
-
105
-
106
-
107
-
108
-
109
-
110
-
111
-
112
-
113
-
114
-
115
-
116
-
117
-
118
-
119
-
120
-
121
-
122
-
123
-
124
-
125
-
126
-
127
-
128
-
129
-
130
-
131
-
132
-
133
-
134
-
135
-
136
-
137
-
138
-
139
-
140
-
141
-
142
-
143
-
144
-
145
-
146
-
147
-
148
-
149
-
150
-
151
-
152
-
153
-
154
-
155
-
156
-
157
-
158
-
159
-
160
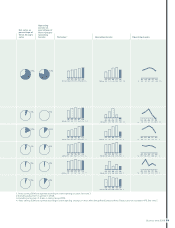
 |
 |

0807060504
12.215.214.811.79.0
SEK bn
Net sales1)
Net sales as
percentage of
Volvo Group’s
sales
Operating
income as
percentage of
Volvo Group’s
operating
income Operating income Operating margin
0807060504
203.2187.9171.3155.4136.9SEK bn
0807060504
6.08.18.77.56.6
%
1. Years starting 2006 are reported according to a new reporting structure. See note 7.
2. Excluding adjustment of goodwill in 2006.
3. Excluding write-down of shares in Henlys Group 2004.
4. Years starting 2006 are reported according to a new reporting structure, in which Volvo Group Real Estate and Volvo Treasury are not included in VFS. See note 7.
0807060504
9281,1731,106943940
SEK M
0807060504
359529 359836403
SEK M
0807060504
11.411.710.89.89.1
SEK bn
0807060504
7.47.68.27.56.9
SEK bn
0807060504
8.110.010.39.610.4
%
0807060504
4.86.94.411.15.8
%
0807060504
1.84.24.12.81.9
SEK bn
0807060504
56.153.642.134.829.4
SEK bn
0807060504
3.27.99.77.96.5
%
0807060504
(0.4)1.44.32.82.0
%
0807060504
(76)231745470253
SEK M
0807060504
17.316.617.316.612.7
SEK bn
0807060504
1.3971.6491.6862.0331.365
SEK M
1) 3)
1)
1)
1)
1)
1) 3)
1)
1)
1)
4)
1) 2)
1) 3)
1)
1)
1)
1) 2)
67%
77%
4%
6%
2%
2%
3%
9%
18%
11%
6%
0%
Business areas 2008
51