Volvo 2008 Annual Report Download - page 12
Download and view the complete annual report
Please find page 12 of the 2008 Volvo annual report below. You can navigate through the pages in the report by either clicking on the pages listed below, or by using the keyword search tool below to find specific information within the annual report.-
 1
1 -
 2
2 -
 3
3 -
 4
4 -
 5
5 -
 6
6 -
 7
7 -
 8
8 -
 9
9 -
 10
10 -
 11
11 -
 12
12 -
 13
13 -
 14
14 -
 15
15 -
 16
16 -
 17
17 -
 18
18 -
 19
19 -
 20
20 -
 21
21 -
 22
22 -
23
-
24
-
25
-
26
-
27
-
28
-
29
-
30
-
31
-
32
-
33
-
34
-
35
-
36
-
37
-
38
-
39
-
40
-
41
-
42
-
43
-
44
-
45
-
46
-
47
-
48
-
49
-
50
-
51
-
52
-
53
-
54
-
55
-
56
-
57
-
58
-
59
-
60
-
61
-
62
-
63
-
64
-
65
-
66
-
67
-
68
-
69
-
70
-
71
-
72
-
73
-
74
-
75
-
76
-
77
-
78
-
79
-
80
-
81
-
82
-
83
-
84
-
85
-
86
-
87
-
88
-
89
-
90
-
91
-
92
-
93
-
94
-
95
-
96
-
97
-
98
-
99
-
100
-
101
-
102
-
103
-
104
-
105
-
106
-
107
-
108
-
109
-
110
-
111
-
112
-
113
-
114
-
115
-
116
-
117
-
118
-
119
-
120
-
121
-
122
-
123
-
124
-
125
-
126
-
127
-
128
-
129
-
130
-
131
-
132
-
133
-
134
-
135
-
136
-
137
-
138
-
139
-
140
-
141
-
142
-
143
-
144
-
145
-
146
-
147
-
148
-
149
-
150
-
151
-
152
-
153
-
154
-
155
-
156
-
157
-
158
-
159
-
160
 |
 |
China
India
Asia/Pacific*
Annual GDP growth
Source: Consensus Economics
0807060504
9.2
11.911.610.410.1
6.7
9.09.69.47.5
4.06.26.25.65.9
* China, Hong Kong, South Korea, Taiwan, Indonesia, Malaysia, Singapore,
Thailand, Phillippines, Vietnam, Australia, New Zealand, India, Japan, Sri Lanka
Brent oil:
(USD/barrel)
0807060504
36.297.757.358.740.6
03
30.3
Source: Reuters
GDP-growth in the US and in Europe, %Brent Oil Growth in Asia, %
USA
Annual GDP-growth.
Source: Consensus Economics
Europe
0807060504
1.13.03.32.22.6
1.22.02.82.93.6
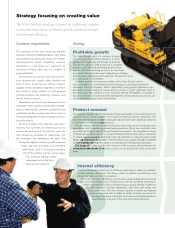
Sharp downturn in the global economy
Downturn aggravated by fi nancial crisis
After a positive development during the fi rst six months of the year, global growth softened during the second half
of 2008. The fi nancial turmoil and the recession spread from North America to Europe and subsequently further
east. The downturn in the economy was signfi cantly aggravated when the fi nancial crisis, that started in the hous-
ing market in the US, spread through the global fi nancial system. The tightening of credit that followed led to great
diffi culties for both businesses and households to fi nance investments as well as consumption, with a sharp
downturn in the global economy as a consequence.
Many central banks cut interest rates sharply toward the end of 2008 to stimulate the economy. In addition,
many countries decided on monetary and fi nancial measures to cushion the decline, including increased govern-
ment subsidies for investments in infrastructure. Despite the expected positive effects of the stimulus measures,
both the OECD and UN project that the recession will extend also through 2010. The OECD, as stated in its
Economic Outlook No. 84 published in November 2008, expects that GDP in the OECD area will decline by
slightly more than 1% during 2009. This is the weakest development since World War II. According to the report
World Economic Situation and Prospects 2009, the UN foresees a Global GDP development during 2009 of at
worst minus 0.4% and at best growth of 1.6%. This can be compared with growth of 2.5% in 2008 and 3.8% in
2007
Long-term transport need
In recent years, the growth economies in Asia, Eastern Europe and South America have contribute signifi -
cantly to the world’s strong economic trend. The BRIC countries – Brazil, Russia, India and China – account
for one-quarter of the world’s GDP, a substantial increase from 17% in 1990, according to the OECD. North
America and the EU, however, remain indisputably the largest economies, accounting collectively for
approximately 60% of the world’s GDP. During the same period world trade has increased dramatically. Total
trade in relation to the world’s total GDP has more than doubled since 1970 – from 12% to 27%. The percentage
of export of the growth countries has doubled – from 20% to approximately 40%. Growth in trade creates higher
requirements for the transport of goods between and within various parts of the world, countries and regions. At
the same time, social trends, such as urbanization in many countries imply that ever-increasing numbers of people
require transportation in their daily lives.
The transport requirement is refl ected in demand for transport vehicles, which have reported growth rates of
about 4% a year over a business cycle. Historically, the trend of registrations of heavy trucks has shown wide
fl uctuations in North America but been more stable in Western Europe. The fastest growth has occurred in
Eastern Europe and Asia.
Growth in the economy and in transport also clearly underscores the need for a reliably functioning infrastruc-
ture. In the next few years, major investments in the road network will be carried out in markets such as China,
India and Eastern Europe while stimulus packages in the form of investments in infrastructure are on the agenda
in a number of countries. Increased global wealth means that there is a long-term need to build airports, railways,
factories and shopping centers, as well as housing and recreational facilities.
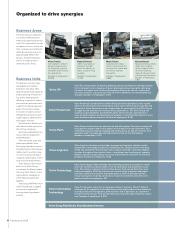
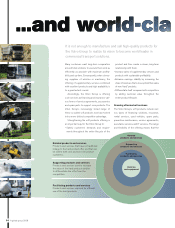
After a strong start to the year, demand weakened signifi cantly on most
the Volvo Group’s markets during the second half of 2008 as a conse-
quence of the fi nancial crisis and weaker global growth.
A global group 2008
8