Volvo 2008 Annual Report Download - page 44
Download and view the complete annual report
Please find page 44 of the 2008 Volvo annual report below. You can navigate through the pages in the report by either clicking on the pages listed below, or by using the keyword search tool below to find specific information within the annual report.-
 1
1 -
2
-
3
-
4
-
5
-
6
-
7
-
8
-
9
-
10
-
11
-
12
-
13
-
14
-
15
-
16
-
17
-
18
-
19
-
20
-
21
-
22
-
23
-
24
-
25
-
26
-
27
-
28
-
29
-
30
-
31
-
32
-
33
-
 34
34 -
 35
35 -
 36
36 -
 37
37 -
 38
38 -
 39
39 -
 40
40 -
 41
41 -
 42
42 -
 43
43 -
 44
44 -
 45
45 -
 46
46 -
 47
47 -
 48
48 -
 49
49 -
 50
50 -
 51
51 -
 52
52 -
 53
53 -
 54
54 -
55
-
56
-
57
-
58
-
59
-
60
-
61
-
62
-
63
-
64
-
65
-
66
-
67
-
68
-
69
-
70
-
71
-
72
-
73
-
74
-
75
-
76
-
77
-
78
-
79
-
80
-
81
-
82
-
83
-
84
-
85
-
86
-
87
-
88
-
89
-
90
-
91
-
92
-
93
-
94
-
95
-
96
-
97
-
98
-
99
-
100
-
101
-
102
-
103
-
104
-
105
-
106
-
107
-
108
-
109
-
110
-
111
-
112
-
113
-
114
-
115
-
116
-
117
-
118
-
119
-
120
-
121
-
122
-
123
-
124
-
125
-
126
-
127
-
128
-
129
-
130
-
131
-
132
-
133
-
134
-
135
-
136
-
137
-
138
-
139
-
140
-
141
-
142
-
143
-
144
-
145
-
146
-
147
-
148
-
149
-
150
-
151
-
152
-
153
-
154
-
155
-
156
-
157
-
158
-
159
-
160
 |
 |

emission regulations in Europe, USA and
Japan in 2009 and 2010 as well as spending
on projects for the launch of diesel-electric
hybrids the next few years. The net of research
and development expense capitalization and
amortization had a negative impact of SEK
800 M compared with a negative impact of
SEK 400 M in 2007.
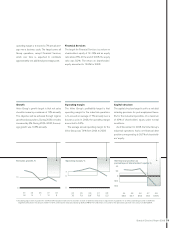
Impact of exchange rates on operating
income
The combined effect of changed exchange
rates, particularly for the USD, had an adverse
effect on operating income of approximately
SEK 900 M in 2008, compared with 2007.
The main reason is that the USD was weak
during most of 2008.
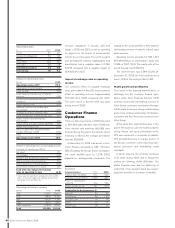
Customer Finance
Operations
Total new fi nancing volume in 2008 amounted
to SEK 44.5 billion (41.4). In total, 47,986 new
Volvo vehicles and machines (46,686) were
fi nanced during the year. In the markets where
fi nancing is offered, the average penetration
rate was 25% (24).
At December 31, 2008 total assets in Cus-
tomer Finance amounted to SEK 118 billion
(95). Excluding the Nissan diesel receivables,
the credit portfolio grew by 12.7% (12.6),
adjusted for exchange-rate movements. The
funding of the credit portfolio is fully matched
with lending in terms of maturity, interest rates
and currencies.
Operating income amounted to SEK 1,397
M (1,649). Return on shareholders’ equity was
12.6% in 2007 (15.9). The equity ratio at the
end of the year was 8.2% (8.1).
The write-off ratio was 0.54% (0.29). On
December 31, 2008, the total credit reserves
were 1.37% of the credit portfolio (1.59).
Stable growth and profi tability
The turmoil in the fi nancial markets poses a
challenge, but the customer fi nance oper-
ations within Volvo Financial Services (VFS)
continues to provide vital fi nancial services to
Volvo Group customers and dealers through-
out the world, focusing on strong credit discipline
and a close working relationship with dealers,
customers and the other business areas in the
Volvo Group.
At the same time, opportunities arise in this
part of the business cycle. As evidenced by the
strong volume and good penetration levels,
VFS was successful in a number of markets.
VFS provided fi nancing to a larger portion of
the Group’s customers while improving oper-
ational processes and maintaining credit
standards.
In North America, the economy continued
to be weak during 2008, and in Europe the
markes are showing similar diffi culties. The
global fi nancial crisis and the tightening of
credit that it has brought about has exacer-
bated the downturn in a number of markets.
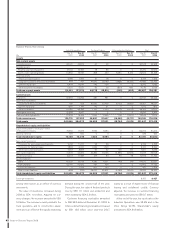
Operating margin
% 2007 2008
Trucks 8.1 6.0
Construction Equipment 7.9 3.2
Buses 1.4 (0.4)
Volvo Penta 10.0 8.1
Volvo Aero 6.9 4.8
Industrial operations 7.4 4.9
Volvo Group 7.8 5.2
Operating net fl ow per currency
SEK M 2007 2008
USD 19,000 23,600
EUR 17,800 15,700
GBP 8,700 7,700
CAD 2,000 1,900
Other currencies 15,800 12,200
Total 63,300 61,100
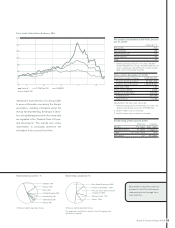
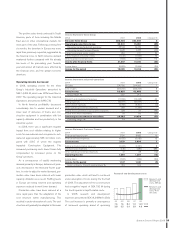
Change in operating income
SEK bn 2008
Operating income 2007 22.2
Improvement of gross margins 4.5
Lower volumes (0.6)
Lower capacity utilization, lay-off related
costs etc. (3.9)
Income from acquired and divested
operations (0.4)
Higher warranty costs (0.6)
Additional provisions for residual value
commitments (0.6)
Changes in currency exchange rates (0.9)
Lower capitalization of development costs (0.1)
Higher research and development
expenditures (2.0)
Higher selling and administrative expenses (0.2)
Higher restructuring costs (0.5)
Gain on sale of Petro Stopping Centers
and Sörred Energi in 2007 (0.5)
Other (0.5)
Operating income 2008 15.9
Impact of exchange rates on operating income
Compared with preceding year, SEK bn
Net sales12.5
Cost of sales (2.4)
Research and development expenses 0.0
Selling and administrative expenses (0.1)
Other operating income and expenses (0.9)
Income from investments in shares 0.0
Total effect of changes in exchange
rates on operating income (0.9)
1 Group sales are reported at average spot rates and the
effects of currency hedges are reported among “Other
operating income and expenses”.
Key ratios
Financial Services 2007 2008
Credit portfolio net, SEK bn 91.1 112.3
Operating income, SEK M 1,649 1,397
Return on shareholders’
equity, % 15.9 12.6
Market penetration, % 24.1 24.9
Penetration by business area, %
Volvo CE 34 36
Volvo Trucks 29 29
Renualt Trucks 16 18
Buses 13 14
Mack Trucks 18 16
40 Board of Directors’ Report 2008