Volvo 2008 Annual Report Download - page 92
Download and view the complete annual report
Please find page 92 of the 2008 Volvo annual report below. You can navigate through the pages in the report by either clicking on the pages listed below, or by using the keyword search tool below to find specific information within the annual report.-
 1
1 -
2
-
3
-
4
-
5
-
6
-
7
-
8
-
9
-
10
-
11
-
12
-
13
-
14
-
15
-
16
-
17
-
18
-
19
-
20
-
21
-
22
-
23
-
24
-
25
-
26
-
27
-
28
-
29
-
30
-
31
-
32
-
33
-
34
-
35
-
36
-
37
-
38
-
39
-
40
-
41
-
42
-
43
-
44
-
45
-
46
-
47
-
48
-
49
-
50
-
51
-
52
-
53
-
54
-
55
-
56
-
57
-
58
-
59
-
60
-
61
-
62
-
63
-
64
-
65
-
66
-
67
-
68
-
69
-
70
-
71
-
72
-
73
-
74
-
75
-
76
-
77
-
78
-
79
-
80
-
81
-
 82
82 -
 83
83 -
 84
84 -
 85
85 -
 86
86 -
 87
87 -
 88
88 -
 89
89 -
 90
90 -
 91
91 -
 92
92 -
 93
93 -
 94
94 -
 95
95 -
 96
96 -
 97
97 -
 98
98 -
 99
99 -
 100
100 -
 101
101 -
 102
102 -
103
-
104
-
105
-
106
-
107
-
108
-
109
-
110
-
111
-
112
-
113
-
114
-
115
-
116
-
117
-
118
-
119
-
120
-
121
-
122
-
123
-
124
-
125
-
126
-
127
-
128
-
129
-
130
-
131
-
132
-
133
-
134
-
135
-
136
-
137
-
138
-
139
-
140
-
141
-
142
-
143
-
144
-
145
-
146
-
147
-
148
-
149
-
150
-
151
-
152
-
153
-
154
-
155
-
156
-
157
-
158
-
159
-
160
 |
 |

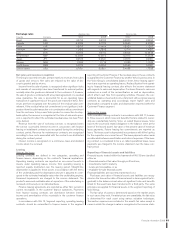
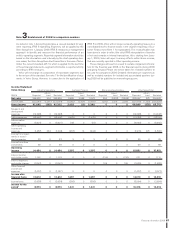
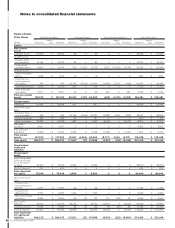
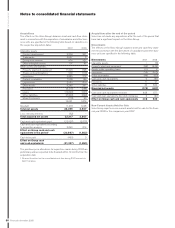
Notes to consolidated fi nancial statements
88
THE VOLVO GROUP
Financial information 2008
Balance Sheets
Volvo Group Industrial operations Customer Finance Elim and reclassifi cations Volvo Group Total
SEK M Reported
Adjust-
ment Restated Reported
Adjust-
ment Restated Reported
Adjust-
ment Restated Reported
Adjust-
ment Restated
Assets
Non-current
assets
Intangible assets 43,909 0 43,909 49 0 49 000 43,958 0 43,958
Tangible assets
Property, plant
and equipment 57,185 0 57,185 86 0 86 000 57,270 0 57,270
Assets under
operating leases 16,967 0 16,967 330 12,908 13,238 8,132 (12,908) (4,776) 25,429 0 25,429
Financial assets
Shares and partici-
pations 1,935 0 1,935 18 0 18 000 1,953 0 1,953
Long term cus-
tomer fi nancing
receivables 467 0 467 59,189 (8,729) 50,460 (9,224) 8,729 (495) 50,432 0 50,432
Deferred tax assets 10,976 0 10,976 204 0 204 000 11,180 0 11,180
Other long-term
receivables 5,631 0 5,631 38 0 38 489 0 489 6,159 0 6,159
Total non-current
assets 137,070 0 137,070 59,914 4,179 64,093 (603) (4,179) (4,782) 196,381 0 196,381
Current assets
Inventories 54,084 0 54,084 961 0 961 000 55,045 0 55,045
Short-term receiv-
ables
Customer-fi nan-
cing receivables 508 0 508 52,436 (4,054) 48,382 (4,887) 4,054 (833) 48,057 0 48,057
Current tax assets 1,749 0 1,749 61 0 61 000 1,810 0 1,810
Other receivables 48,286 0 48,286 1,902 0 1,902 (2,677) 0 (2,677) 47,512 0 47,512
Marketable
securities 5,901 0 5,901 202 000 5,902 0 5,902
Cash and cash
equivalents 16,674 0 16,674 2,245 0 2,245 (1,207) 0 (1,207) 17,712 0 17,712
Total current
assets 127,202 0 127,202 57,607 (4,054) 53,553 (8,771) 4,054 (4,717) 176,038 0 176,038
Total assets 264,272 0 264,272 117,521 125 117,646 (9,374) (125) (9,499) 372,419 0 372,419
Shareholders’
equity and
liabilities
Shareholders’
equity
Equity attributable
to the equity hold-
ers of the parent
company 74,416 0 74,416 9,594 0 9,594 000 84,010 0 84,010
Minority interests 630 0 630 000 000 630 0 630
Total sharehold-
ers’ equity 75,046 0 75,046 9,594 0 9,594 000 84,640 0 84,640
Non-current provi-
sions
Provisions for
post-employment
benefi ts 11,677 0 11,677 28 0 28 000 11,705 0 11,705
Provisions for
deferred taxes 6,557 0 6,557 1,703 0 1,703 000 8,260 0 8,260
Other non-current
provisions 8,869 0 8,869 62 85 147 135 (85) 50 9,066 0 9,066
Non-current
liabilities 43,062 0 43,062 53,155 0 53,155 (3,609) 0 (3,609) 92,608 0 92,608
Current provisions 11,589 0 11,589 83 40 123 78 (40) 38 11,750 0 11,750
Current liabilities 107,472 0 107,472 52,896 0 52,896 (5,978) 0 (5,978) 154,390 0 154,390
Total sharehold-
ers’ equity and
liabilities 264,272 0 264,272 117,521 125 117,646 (9,374) (125) (9,499) 372,419 0 372,419