Volvo 2008 Annual Report Download - page 152
Download and view the complete annual report
Please find page 152 of the 2008 Volvo annual report below. You can navigate through the pages in the report by either clicking on the pages listed below, or by using the keyword search tool below to find specific information within the annual report.-
 1
1 -
2
-
3
-
4
-
5
-
6
-
7
-
8
-
9
-
10
-
11
-
12
-
13
-
14
-
15
-
16
-
17
-
18
-
19
-
20
-
21
-
22
-
23
-
24
-
25
-
26
-
27
-
28
-
29
-
30
-
31
-
32
-
33
-
34
-
35
-
36
-
37
-
38
-
39
-
40
-
41
-
42
-
43
-
44
-
45
-
46
-
47
-
48
-
49
-
50
-
51
-
52
-
53
-
54
-
55
-
56
-
57
-
58
-
59
-
60
-
61
-
62
-
63
-
64
-
65
-
66
-
67
-
68
-
69
-
70
-
71
-
72
-
73
-
74
-
75
-
76
-
77
-
78
-
79
-
80
-
81
-
82
-
83
-
84
-
85
-
86
-
87
-
88
-
89
-
90
-
91
-
92
-
93
-
94
-
95
-
96
-
97
-
98
-
99
-
100
-
101
-
102
-
103
-
104
-
105
-
106
-
107
-
108
-
109
-
110
-
111
-
112
-
113
-
114
-
115
-
116
-
117
-
118
-
119
-
120
-
121
-
122
-
123
-
124
-
125
-
126
-
127
-
128
-
129
-
130
-
131
-
132
-
133
-
134
-
135
-
136
-
137
-
138
-
139
-
140
-
141
-
 142
142 -
 143
143 -
 144
144 -
 145
145 -
 146
146 -
 147
147 -
 148
148 -
 149
149 -
 150
150 -
 151
151 -
 152
152 -
 153
153 -
 154
154 -
 155
155 -
 156
156 -
 157
157 -
 158
158 -
 159
159 -
 160
160
 |
 |
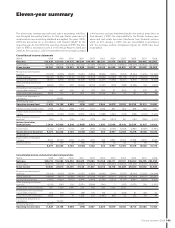
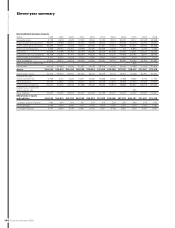
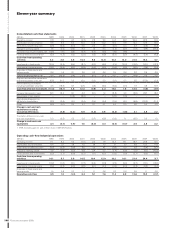
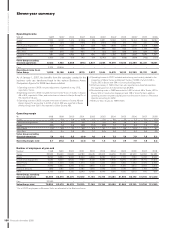
Eleven-year summary
148
ELEVEN-YEAR SUMMARY
Financial information 2008
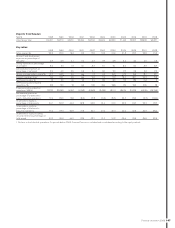
Volvo share statistics
Data per share (adjusted for issues and splits)1
1998 1999 2000 2001 2002 2003 2004 2005 2006 2007 2008
Basic earnings, SEK13.82 14.60 2.24 (0.70) 0.66 0.14 4.72 6.44 8.03 7.37 4.90
Cash dividend, SEK 1.20 1.40 1.60 1.60 1.60 1.60 2.50 3.35 10.0095.50 2.0010
Share price at year-end, SEK (B share) 37.2 44 31.3 35.2 28.4 44 52.7 74.9 90.70 108.50 42.90
Direct return, % (B share) 23.2 3.2 5.1 4.5 5.6 10.584.7 4.5 11.0 5.1 4.7
Effective return, % (B share)3(10) 22 (23) 17.6 (14.8) 71.2 25.5 48.5 39.8 25.7 (59)
Price/earnings ratio (B share)49 3 14 neg 43 310 11.2 11.6 11.3 14.7 8.8
EBIT multiple511 10 10 25 23 14 9.2 9.3 10.3 9.7 3.6
Payout ratio, %631 10 71 neg 242 1,143 53 52 62 75 41
Shareholders’ equity, SEK731.4 44.2 44.4 40.6 37.4 34.6 34 38.8 43 41 41
Return on shareholders’ equity 13.0 34.9 5.0 neg 1.7 0.4 13.9 17.8 19.6 18.1 12.1
Other share data 1998 1999 2000 2001 2002 2003 2004 2005 2006 2007 2008
Number of shareholders
at year-end 210,600 238,000 230,000 214,000 211,000 208,500 202,300 195,442 183,735 197,519 220,192
Number of Series A shares out-
standing at year-end, million 138.6 138.6 124.7 131.7 131.7 131.7 131.5 131.4 131.4 657 657
Number of Series B shares
outstanding at year-end, million 302.9 302.9 272.6 287.8 287.8 287.8 278.6 273.1 273.4 1,369 1,371
Average number of outstanding
shares, million 441.5 441.5 421.7 422.4 419.4 419.4 418.5 405.2 404.7 2,025 2,027
Number of Series A shares traded in
Stockholm during the year, million 34.5 27.0 42.4 40.3 27.3 31.4 42.0 39.3 56.4 172.3 308
Number of Series B shares
traded in Stockholm during the
year, million 371.3 479.6 391.2 344.4 349.4 404.8 498.0 518.7 617.0 2,712.4 3,130.0
Number of shares traded in ADR,
NASDAQ during the year, million 50.5 54.9 16.0 15.0 11.0 10.4 24.0 19.8 14.1 113.5 –
1 Basic earnings per share is calculated as income for the period divided by
average number of shares outstanding. Reporting according to IFRS from
2004.
2 Proposed dividend in SEK per share divided by share price at year-end.
3 Share price at year-end, including proposed dividend during the year, divided
by share price at beginning of the year, (2006 includes a share split 6:1 in
which the sixth share was redeemed by AB Volvo for an amount of SEK 5.00
per share).
4 Share price at year-end divided by basic earnings per share.
5 Market value at year-end minus net fi nancial position and minority interests
divided by operating income excluding restructuring costs and revaluation of
shares.
6 Cash dividend divided by basic earnings per share.
7 Shareholders’ equity for shareholders in AB Volvo divided by number of
shares outstanding at year-end.
8 Including distribution of shares in Ainax equal to SEK 3.01 (share-split
adjusted) per Volvo share in 2004.
9 Including extrapayment of SEK 5 through redemption of shares.
10 Proposed by the Board of Directors.
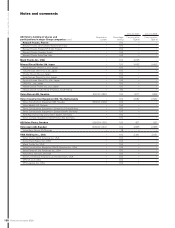
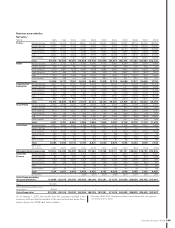
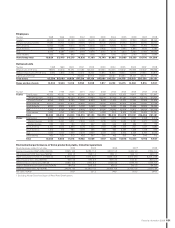
The largest shareholders in AB Volvo, December 31, 20081
Number of
shares
% of total
votes
Share
capital, %
Renault SA 441,520,885 21.3 21.8
Industrivärden 69,975,606 8.8 3.5
Violet Partners LP 43,727,400 5.5 2.2
AFA Insurance 48,466,587 4.9 2.4
Svenska Handelsbanken236,534,768 4.6 1.8
AMF Pension and Funds 67,864,006 4.1 3.3
Alecta (pension funds) 59,075,000 3.3 2.9
SEB fonder (savings funds)/
Trygg Försäkring 49,076,988 3.2 2.4
Skandia Liv 25,333,390 2.6 1.2
Swedbank Robur fonder 72,794,001 2.5 3.6
Total 914,368,631 60.8 45.1
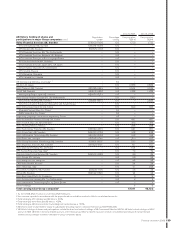
Distribution of shares, December 31, 20081
Volvo shareholders
Number of
shareholders
% of total
votes1
Share of
capital, %1
1–1,000 shares 164,631 2.1 2.4
1,001–10,000 shares 50,814 5.6 6.9
10,001–100,000 shares 4,101 3.5 4.8
100,001– 646 88.8 85.9
Total 220,192 100 100
1 Based on the number of outstanding shares.
2 Svenska Handelsbanken comprises shares held by Svenska Handelsbanken,
Svenska Handelsbanken Pension Fund, Svenska Handelsbanken Personnel
Foundation, Svenska Handelsbanken pensionskassa and Oktogonen.
Following the repurchase of its own shares, AB Volvo held 4.8% of the
Company’s shares on Dec. 31, 2008.
1 Based on all registered shares.