Volvo 2008 Annual Report Download - page 94
Download and view the complete annual report
Please find page 94 of the 2008 Volvo annual report below. You can navigate through the pages in the report by either clicking on the pages listed below, or by using the keyword search tool below to find specific information within the annual report.-
 1
1 -
2
-
3
-
4
-
5
-
6
-
7
-
8
-
9
-
10
-
11
-
12
-
13
-
14
-
15
-
16
-
17
-
18
-
19
-
20
-
21
-
22
-
23
-
24
-
25
-
26
-
27
-
28
-
29
-
30
-
31
-
32
-
33
-
34
-
35
-
36
-
37
-
38
-
39
-
40
-
41
-
42
-
43
-
44
-
45
-
46
-
47
-
48
-
49
-
50
-
51
-
52
-
53
-
54
-
55
-
56
-
57
-
58
-
59
-
60
-
61
-
62
-
63
-
64
-
65
-
66
-
67
-
68
-
69
-
70
-
71
-
72
-
73
-
74
-
75
-
76
-
77
-
78
-
79
-
80
-
81
-
82
-
83
-
 84
84 -
 85
85 -
 86
86 -
 87
87 -
 88
88 -
 89
89 -
 90
90 -
 91
91 -
 92
92 -
 93
93 -
 94
94 -
 95
95 -
 96
96 -
 97
97 -
 98
98 -
 99
99 -
 100
100 -
 101
101 -
 102
102 -
 103
103 -
 104
104 -
105
-
106
-
107
-
108
-
109
-
110
-
111
-
112
-
113
-
114
-
115
-
116
-
117
-
118
-
119
-
120
-
121
-
122
-
123
-
124
-
125
-
126
-
127
-
128
-
129
-
130
-
131
-
132
-
133
-
134
-
135
-
136
-
137
-
138
-
139
-
140
-
141
-
142
-
143
-
144
-
145
-
146
-
147
-
148
-
149
-
150
-
151
-
152
-
153
-
154
-
155
-
156
-
157
-
158
-
159
-
160
 |
 |
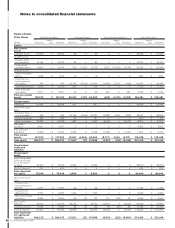
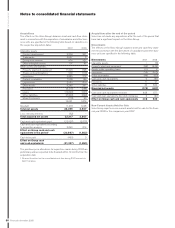
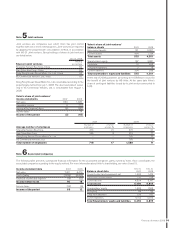
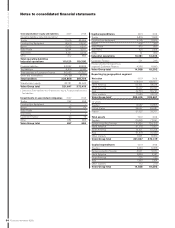
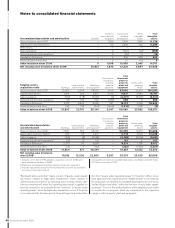
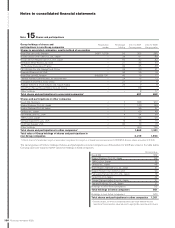
Notes to consolidated fi nancial statements
90
THE VOLVO GROUP
Financial information 2008
2007 2008
Intangible assets
Product development 3,356 201
Trademarks 2,587 0
Distribution network 803 302
Other intangible assets 107 82
Other assets and liabilities
Property plant and equipment 11,226 898
Shares and participations 939 (113)
Inventories 4,885 278
Current receivables 7,205 186
Liquid funds 2,090 819
Other assets 6,285 261
Provisions (6,215) (284)
Loans (12,099) (347)
Other liabilities (8,909) (499)
Minority interests (179) 95
12,081 1,879
Goodwill 11,418 1,028
Total net assets 23,499 2,907
Less: minority interests (82) –
Total acquired net assets 23,417 2,907
Cash and cash equivalents paid (22,957) (2,672)
Cash and cash equivalents according
to acquisition analysis 2,090 819
Effect on Group cash and cash
equivalents in the period1(20,867) (1,853)
Cash to be paid (460) 0
Effect on Group cash
and cash equivalents (21,327) (1,853)
The purchase price allocations for aquisitions made during 2008 are
preliminary and are expected to be fi nalized within 12 months from the
acquisition date
1 Whereof the effect on the consolidated cash fl ow during 2007 amounts to
SEK 15.4 billion.
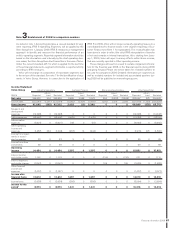
Acquisitions
The effects on the Volvo Group’s balance sheet and cash fl ow state-
ment in connection with the acquisition of subsidiaries and other busi-
ness units are specifi ed in the following table based on valuations on
the respective acquisition dates:
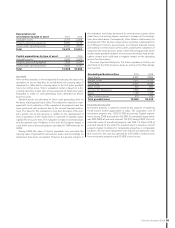
Acquisitions after the end of the period
Volvo has not made any acquisitions after the end of the period that
have had a signifi cant impact on the Volvo Group.
Divestments
The effects on the Volvo Group’s balance sheet and cash-fl ow state-
ment in connection with the divestment of subsidiaries and other busi-
ness units are specifi ed in the following table:
Divestments 2007 2008
Intangible assets – (3)
Property, plant and equipment (96) (445)
Assets under operating lease (11) 0
Inventories (79) (513)
Other receivables (48) (90)
Cash and cash equivalents 0 (41)
Provisions 17 21
Other liabilities 42 644
Divested net assets (175) (427)
Cash and cash equivalents received 408 577
Cash and cash equivalents, divested companies 0 (41)
Effect on Group cash and cash equivalents 408 536
Non-Current Assets Held for Sale
Volvo Group reports no non-current assets held for sale for the fi nan-
cial year 2008 or the comparison year 2007.