Volvo 2008 Annual Report Download - page 108
Download and view the complete annual report
Please find page 108 of the 2008 Volvo annual report below. You can navigate through the pages in the report by either clicking on the pages listed below, or by using the keyword search tool below to find specific information within the annual report.-
 1
1 -
2
-
3
-
4
-
5
-
6
-
7
-
8
-
9
-
10
-
11
-
12
-
13
-
14
-
15
-
16
-
17
-
18
-
19
-
20
-
21
-
22
-
23
-
24
-
25
-
26
-
27
-
28
-
29
-
30
-
31
-
32
-
33
-
34
-
35
-
36
-
37
-
38
-
39
-
40
-
41
-
42
-
43
-
44
-
45
-
46
-
47
-
48
-
49
-
50
-
51
-
52
-
53
-
54
-
55
-
56
-
57
-
58
-
59
-
60
-
61
-
62
-
63
-
64
-
65
-
66
-
67
-
68
-
69
-
70
-
71
-
72
-
73
-
74
-
75
-
76
-
77
-
78
-
79
-
80
-
81
-
82
-
83
-
84
-
85
-
86
-
87
-
88
-
89
-
90
-
91
-
92
-
93
-
94
-
95
-
96
-
97
-
 98
98 -
 99
99 -
 100
100 -
 101
101 -
 102
102 -
 103
103 -
 104
104 -
 105
105 -
 106
106 -
 107
107 -
 108
108 -
 109
109 -
 110
110 -
 111
111 -
 112
112 -
 113
113 -
 114
114 -
 115
115 -
 116
116 -
 117
117 -
 118
118 -
119
-
120
-
121
-
122
-
123
-
124
-
125
-
126
-
127
-
128
-
129
-
130
-
131
-
132
-
133
-
134
-
135
-
136
-
137
-
138
-
139
-
140
-
141
-
142
-
143
-
144
-
145
-
146
-
147
-
148
-
149
-
150
-
151
-
152
-
153
-
154
-
155
-
156
-
157
-
158
-
159
-
160
 |
 |

Notes to consolidated fi nancial statements
104
THE VOLVO GROUP
Financial information 2008
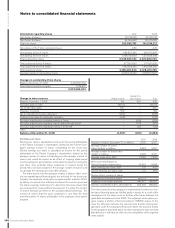
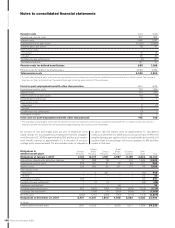
Information regarding shares 2007 2008
Own Series A shares 20,728,135 20,728,135
Own Series B shares 82,054,652 80,310,082
Total own shares 102,782,787 101,038,217
Own shares in % of total registered shares 4.80 4.75
Outstanding Series A shares 656,873,495 656,873,495
Outstanding Series B shares 1,368,763,938 1,370,508,508
Total outstanding shares 2,025,637,433 2,027,382,003
Total registered Series A shares 677,601,630 677,601,630
Total registered Series B shares 1,450,818,590 1,450,818,590
Total registered shares 2,128,420,220 2,128,420,220
Average number of outstanding shares 2,025,279,790 2,026,977,937
Changes in outstanding Volvo shares
Balance December 31, 2007 2,025,637,433
Share-based incentive program 1,744,570
2,027,382,003
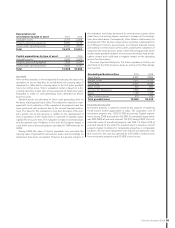
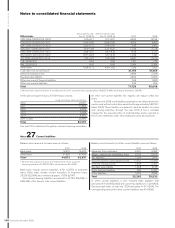
Change in other reserves Hedge reserve
Available for
sale-reserve Total
Balance at January 1, 2008 182 253 435
Fair value gains in year (3,671) – (3,671)
Tax on fair value gains 967 – 967
Transfers to income 792 – 792
Tax on transfers to income statement (222) – (222)
Change in fair value of commodity contracts (105) – (105)
Fair value adjustments regarding holding in Deutz – (324) (324)
Fair value adjustments regarding shares held by Nissan Diesel – (110) (110)
Fair value adjustments regarding holding in Vindic AB – (25) (25)
Other –– -
Balance at December 31, 2008 (2,057) (206) (2,263)
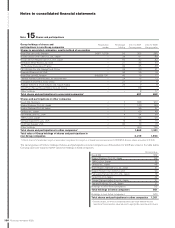
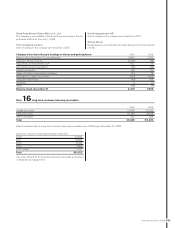
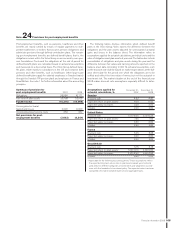
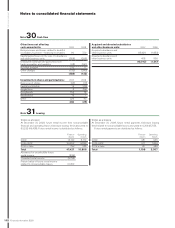
Earnings per share
Earnings per share is calculated as income for the period, attributable
to the Parent Company’s shareholders, divided by the Parent Com-
pany’s average number of shares outstanding for the fi scal year.
Diluted earnings per share is calculated as income for the period
attributable to the Parent Company’s shareholders divided by the
average number of shares outstanding plus the average number of
shares that would be issued as an effect of ongoing share-based
incentive programs and employee stock option programs. If during the
year there were potential shares redeemed or expired during the
period, these are also included in the average number of shares used
to calculate the earnings per share after dilution.
The share-based incentive program creates a dilution effect when
the non-market-based fi nancial goals are achieved for the fi scal year.
Similarly, the employee stock option program creates a dilution effect
by taking into account the difference between the exercise price and
the share’s average market price to determine how many shares that
are assumed to be issued without any payment. It is solely this number
of shares that have an effect on the calculated diluted earnings. The
number of shares that this value symbolizes is less than the total
potential number of shares attributable to the employee stock option
program.
2007 2008
Number of shares, December 31, in millions 2,026 2,027
Average number of shares
before dilution in millions 2,025 2,027
Average number of shares after
dilution in millions 2,026 2,027
Average share price, SEK 118.39 73.80
Net income attributable to
Parent Company shareholders 14,932 9,942
Basic earnings per share, SEK 7.37 4.90
Diluted earnings per share, SEK 7.37 4.90
Dilution effect, number of shares
Share-based incentive program 143,073 –
Employee stock option program 462,477 188,822
Number of potential shares, December 31 605,550 188,822
The share-based incentive program is implemented if certain non-mar-
ket based fi nancial goals are fulfi lled partly or wholly. As a result of the
development of the share price no dilution effect arise between the
grant date and year-end close 2008. The employee stock option pro-
gram creates a dilution effect amounting to 188,822 shares. In this
case, the difference between the exercise price and the share’s aver-
age value under the actual period has been taken into account. Except
for the programs described above no other transactions have occurred
that affected, or will have an effect on, the compilation of the reported
share capital.