Volvo 2008 Annual Report Download - page 105
Download and view the complete annual report
Please find page 105 of the 2008 Volvo annual report below. You can navigate through the pages in the report by either clicking on the pages listed below, or by using the keyword search tool below to find specific information within the annual report.-
 1
1 -
2
-
3
-
4
-
5
-
6
-
7
-
8
-
9
-
10
-
11
-
12
-
13
-
14
-
15
-
16
-
17
-
18
-
19
-
20
-
21
-
22
-
23
-
24
-
25
-
26
-
27
-
28
-
29
-
30
-
31
-
32
-
33
-
34
-
35
-
36
-
37
-
38
-
39
-
40
-
41
-
42
-
43
-
44
-
45
-
46
-
47
-
48
-
49
-
50
-
51
-
52
-
53
-
54
-
55
-
56
-
57
-
58
-
59
-
60
-
61
-
62
-
63
-
64
-
65
-
66
-
67
-
68
-
69
-
70
-
71
-
72
-
73
-
74
-
75
-
76
-
77
-
78
-
79
-
80
-
81
-
82
-
83
-
84
-
85
-
86
-
87
-
88
-
89
-
90
-
91
-
92
-
93
-
94
-
 95
95 -
 96
96 -
 97
97 -
 98
98 -
 99
99 -
 100
100 -
 101
101 -
 102
102 -
 103
103 -
 104
104 -
 105
105 -
 106
106 -
 107
107 -
 108
108 -
 109
109 -
 110
110 -
 111
111 -
 112
112 -
 113
113 -
 114
114 -
 115
115 -
116
-
117
-
118
-
119
-
120
-
121
-
122
-
123
-
124
-
125
-
126
-
127
-
128
-
129
-
130
-
131
-
132
-
133
-
134
-
135
-
136
-
137
-
138
-
139
-
140
-
141
-
142
-
143
-
144
-
145
-
146
-
147
-
148
-
149
-
150
-
151
-
152
-
153
-
154
-
155
-
156
-
157
-
158
-
159
-
160
 |
 |

101
Financial information 2008
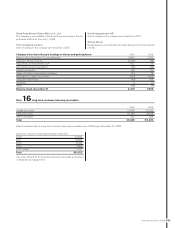
Dong Feng Nissan Diesel Motor Co., Ltd
The company is consolidated in the Volvo Group according to the pro-
portionate method as from July 1, 2008.
Petro Stopping Centers
Volvo’s holdings in the company were divested in 2007.
Småföretagarinvest AB
Volvo’s holdings in the company were divested in 2007.
Nissan Diesel
Nissan Diesel is consolidated in the Volvo Group as of the fi rst quarter
of 2007.
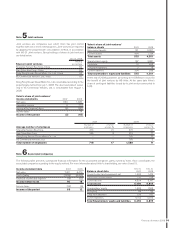
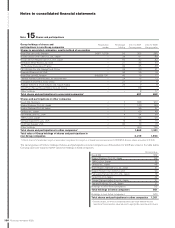
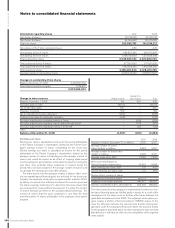
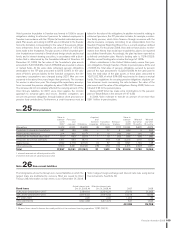
Changes in the Volvo Group’s holdings of shares and participations: 2007 2008
Balance sheet, December 31, preceding year 6,890 2,219
Change in Group structure (5,535) (88)
Acquisitions and divestments, net 907 16
Net of write-downs/revaluations (15) (33)
Capital contribution 155 56
Share of income in associated companies 108 15
Revaluation of shares to fair value (204) (546)
Translation differences (39) 325
Dividends 0 (7)
Other (48) (4)
Balance sheet, December 31 2,219 1,953
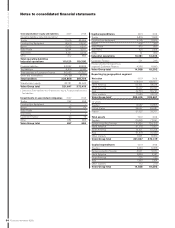
Note 16 Long-term customer-fi nancing receivables
2007 2008
Installment credits 19,836 23,029
Financial leasing 20,298 26,874
Other receivables 352 529
Total 40,486 50,432
Effective interest rate for Long-term customer-fi nancing receivables was 7.20% as per December 31, 2008.
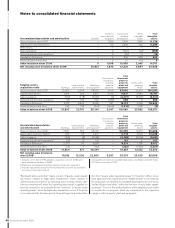
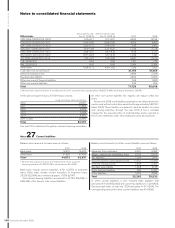
Long-term customer-fi nancing receivables maturities
2010 20,643
2011 15,653
2012 9,243
2013 3,552
2014 or later 1,341
Total 50,432
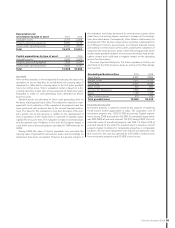
See notes 36 and 37 for fi nancial instruments and goals and policies
in fi nancial risk management.