Volvo 2008 Annual Report Download - page 111
Download and view the complete annual report
Please find page 111 of the 2008 Volvo annual report below. You can navigate through the pages in the report by either clicking on the pages listed below, or by using the keyword search tool below to find specific information within the annual report.-
 1
1 -
2
-
3
-
4
-
5
-
6
-
7
-
8
-
9
-
10
-
11
-
12
-
13
-
14
-
15
-
16
-
17
-
18
-
19
-
20
-
21
-
22
-
23
-
24
-
25
-
26
-
27
-
28
-
29
-
30
-
31
-
32
-
33
-
34
-
35
-
36
-
37
-
38
-
39
-
40
-
41
-
42
-
43
-
44
-
45
-
46
-
47
-
48
-
49
-
50
-
51
-
52
-
53
-
54
-
55
-
56
-
57
-
58
-
59
-
60
-
61
-
62
-
63
-
64
-
65
-
66
-
67
-
68
-
69
-
70
-
71
-
72
-
73
-
74
-
75
-
76
-
77
-
78
-
79
-
80
-
81
-
82
-
83
-
84
-
85
-
86
-
87
-
88
-
89
-
90
-
91
-
92
-
93
-
94
-
95
-
96
-
97
-
98
-
99
-
100
-
 101
101 -
 102
102 -
 103
103 -
 104
104 -
 105
105 -
 106
106 -
 107
107 -
 108
108 -
 109
109 -
 110
110 -
 111
111 -
 112
112 -
 113
113 -
 114
114 -
 115
115 -
 116
116 -
 117
117 -
 118
118 -
 119
119 -
 120
120 -
 121
121 -
122
-
123
-
124
-
125
-
126
-
127
-
128
-
129
-
130
-
131
-
132
-
133
-
134
-
135
-
136
-
137
-
138
-
139
-
140
-
141
-
142
-
143
-
144
-
145
-
146
-
147
-
148
-
149
-
150
-
151
-
152
-
153
-
154
-
155
-
156
-
157
-
158
-
159
-
160
 |
 |

107
Financial information 2008
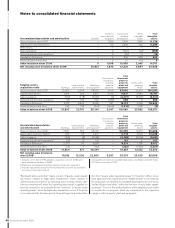
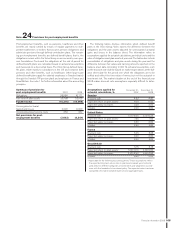
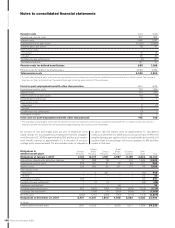
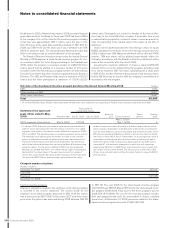
Fair value of plan assets in
funded plans Sweden
Pensions
United
States
Pensions
France
Pensions
Great
Britain
Pensions
US Other
benefi ts
Other
plans Total
Plan assets at January 1, 2007 6,394 12,226 – 4,880 139 1,588 25,227
Acquisitions, divestments and other changes – 643 –––49 692
Expected return on plan assets 384 849 – 275 1 97 1,606
Actuarial gains and (losses) (182) 13 – (45) 4 (12) (222)
Employer contributions 52 ––135 54 144 385
Employee contributions –––33 – 26 59
Exchange rate translation – (751) – (222) (7) 115 (865)
Benefi ts paid – (785) – (145) (55) (129) (1,114)
Plan assets at December 31, 2007 6,648 12,195 – 4,911 136 1,878 25,768
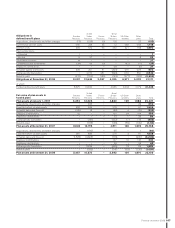
Acquisitions, divestments and other changes – (180) – 95 –1(84)
Expected return on plan assets 397 886 – 275 3 97 1,658
Actuarial gains and (losses) (1,578) (3,695) – (715) – (220) (6,208)
Employer contributions –––147 10 147 304
Employee contributions –––29 – 33 62
Exchange rate translation – 2,226 – (609) 18 64 1,699
Benefi ts paid – (760) – (141) (63) (130) (1,094)
Plan assets at December 31, 2008 5,467 10,672 – 3,992 104 1,870 22,105
Obligations in
defi ned benefi t plans Sweden
Pensions
United
States
Pensions
France
Pensions
Great
Britain
Pensions
US Other
benefi ts
Other
plans Total
Acquisitions, divestments and other changes (13) (226) (2) 116 – 22 (103)
Current year service costs 265 224 55 72 269 263 1,148
Interest costs 383 672 93 250 327 168 1,893
Past service costs
– Unvested 1–––––1
– Vested 6 27 –––639
Termination benefi ts 14 ––––721
Curtailments and settlements (34) 65 (2) – (42) (11) (24)
Employee contributions –––29 – (2) 27
Actuarial (gains) and losses 336 257 47 (304) 261 205 802
Exchange rate translation – 2,212 281 (593) 1,151 891 3,942
Benefi ts paid (312) (790) (185) (143) (577) (552) (2,559)
Obligations at December 31, 2008 9,097 13,648 2,087 4,035 6,971 5,333 41,171
of which
Funded defi ned benefi t plans 8,675 13,322 – 4,035 3,224 2,179 31,435