Volvo 2008 Annual Report Download - page 126
Download and view the complete annual report
Please find page 126 of the 2008 Volvo annual report below. You can navigate through the pages in the report by either clicking on the pages listed below, or by using the keyword search tool below to find specific information within the annual report.-
 1
1 -
2
-
3
-
4
-
5
-
6
-
7
-
8
-
9
-
10
-
11
-
12
-
13
-
14
-
15
-
16
-
17
-
18
-
19
-
20
-
21
-
22
-
23
-
24
-
25
-
26
-
27
-
28
-
29
-
30
-
31
-
32
-
33
-
34
-
35
-
36
-
37
-
38
-
39
-
40
-
41
-
42
-
43
-
44
-
45
-
46
-
47
-
48
-
49
-
50
-
51
-
52
-
53
-
54
-
55
-
56
-
57
-
58
-
59
-
60
-
61
-
62
-
63
-
64
-
65
-
66
-
67
-
68
-
69
-
70
-
71
-
72
-
73
-
74
-
75
-
76
-
77
-
78
-
79
-
80
-
81
-
82
-
83
-
84
-
85
-
86
-
87
-
88
-
89
-
90
-
91
-
92
-
93
-
94
-
95
-
96
-
97
-
98
-
99
-
100
-
101
-
102
-
103
-
104
-
105
-
106
-
107
-
108
-
109
-
110
-
111
-
112
-
113
-
114
-
115
-
 116
116 -
 117
117 -
 118
118 -
 119
119 -
 120
120 -
 121
121 -
 122
122 -
 123
123 -
 124
124 -
 125
125 -
 126
126 -
 127
127 -
 128
128 -
 129
129 -
 130
130 -
 131
131 -
 132
132 -
 133
133 -
 134
134 -
 135
135 -
 136
136 -
137
-
138
-
139
-
140
-
141
-
142
-
143
-
144
-
145
-
146
-
147
-
148
-
149
-
150
-
151
-
152
-
153
-
154
-
155
-
156
-
157
-
158
-
159
-
160
 |
 |

Notes to consolidated fi nancial statements
122
THE VOLVO GROUP
Financial information 2008
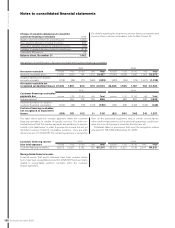
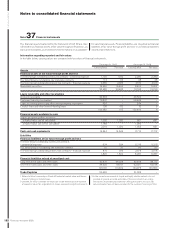
Note 37 Financial instruments
The fi nancial assets treated within the framework of IAS 39 are clas-
sifi ed either as fi nancial assets at fair value through profi t and loss, as
loans and receivables, as investments held to maturity or as available-
for-sale fi nancial assets. Financial liabilities are classifi ed as fi nancial
liabilities at fair value through profi t and loss or as fi nancial liabilities
valued at amortized cost.
Information regarding reported and fair values
In the table below, carrying values are compared with fair values of fi nancial instruments.
December 31, 2007 December 31, 2008
Carrying value Fair value Carrying value Fair value
Assets
Financial assets at fair value through profi t and loss
The Volvo Group’s outstanding currency risk contracts – commercial exposure 1,192 1,192 2,280 2,280
The Volvo Group’s outstanding raw materials contracts 113 113 38 38
The Volvo Group’s outstanding interest risk contracts – fi nancial exposure 2,685 2,685 4,510 4,510
Marketable securities 16,490 16,490 5,902 5,902
20,480 20,480 12,730 12,730
Loans receivable and other receivables
Accounts receivable 30,504 – 30,523 –
Customer fi nancing receivables378,847 – 98,489 –
Loans to external parties and other interest-bearing receivables 525 – 384 –
Conduit loans and other interest-bearing loans 106 102 10 6
109,982 102 129,406 6
Financial assets available for sale
Shares and participations for which:
a market value can be calculated11,030 1,030 661 661
a market value can not be calculated21,189 – 1,292 –
2,219 1,030 1,953 661
Cash and cash equivalents 14,544 14,544 17,712 17,712
Liabilities
Financial liabilities at fair value through profi t and loss
The Volvo Group's outstanding currency risk contracts
– commercial exposure 924 924 5,216 5,216
The Volvo Group’s outstanding raw materials contract 20 20 93 93
The Volvo Group's outstanding interest risk contracts – fi nancial exposure 876 876 2,978 2,978
1,820 1,820 8,287 8,287
Financial liabilities valued at amortized cost
Long term bond loans and other loans 63,470 66,338 82,948 84,712
Short term bank loans and other loans 44,630 44,161 62,027 62,148
108,100 110,499 144,975 146,860
Trade Payables 52,663 – 51,025 –
1 Refers to Volvo’s ownership in Deutz AG valued at market value and Nissan
Diesel’s holdings in listed shares.
2 Unlisted, for which a reliable fair value can not be determined, are reported
at aquisition value. No single block of shares represent a signifi cant amount.
3 In the current environment of illiquid and highly volatile markets, it is not
possible to provide accurate estimates of the price at which an orderly
transaction would take place between willing participants. As such, fair
value estimates have not been provided for the customer fi nance portfolio.