Volvo 2008 Annual Report Download - page 35
Download and view the complete annual report
Please find page 35 of the 2008 Volvo annual report below. You can navigate through the pages in the report by either clicking on the pages listed below, or by using the keyword search tool below to find specific information within the annual report.-
 1
1 -
2
-
3
-
4
-
5
-
6
-
7
-
8
-
9
-
10
-
11
-
12
-
13
-
14
-
15
-
16
-
17
-
18
-
19
-
20
-
21
-
22
-
23
-
24
-
 25
25 -
 26
26 -
 27
27 -
 28
28 -
 29
29 -
 30
30 -
 31
31 -
 32
32 -
 33
33 -
 34
34 -
 35
35 -
 36
36 -
 37
37 -
 38
38 -
 39
39 -
 40
40 -
 41
41 -
 42
42 -
 43
43 -
 44
44 -
 45
45 -
46
-
47
-
48
-
49
-
50
-
51
-
52
-
53
-
54
-
55
-
56
-
57
-
58
-
59
-
60
-
61
-
62
-
63
-
64
-
65
-
66
-
67
-
68
-
69
-
70
-
71
-
72
-
73
-
74
-
75
-
76
-
77
-
78
-
79
-
80
-
81
-
82
-
83
-
84
-
85
-
86
-
87
-
88
-
89
-
90
-
91
-
92
-
93
-
94
-
95
-
96
-
97
-
98
-
99
-
100
-
101
-
102
-
103
-
104
-
105
-
106
-
107
-
108
-
109
-
110
-
111
-
112
-
113
-
114
-
115
-
116
-
117
-
118
-
119
-
120
-
121
-
122
-
123
-
124
-
125
-
126
-
127
-
128
-
129
-
130
-
131
-
132
-
133
-
134
-
135
-
136
-
137
-
138
-
139
-
140
-
141
-
142
-
143
-
144
-
145
-
146
-
147
-
148
-
149
-
150
-
151
-
152
-
153
-
154
-
155
-
156
-
157
-
158
-
159
-
160
 |
 |
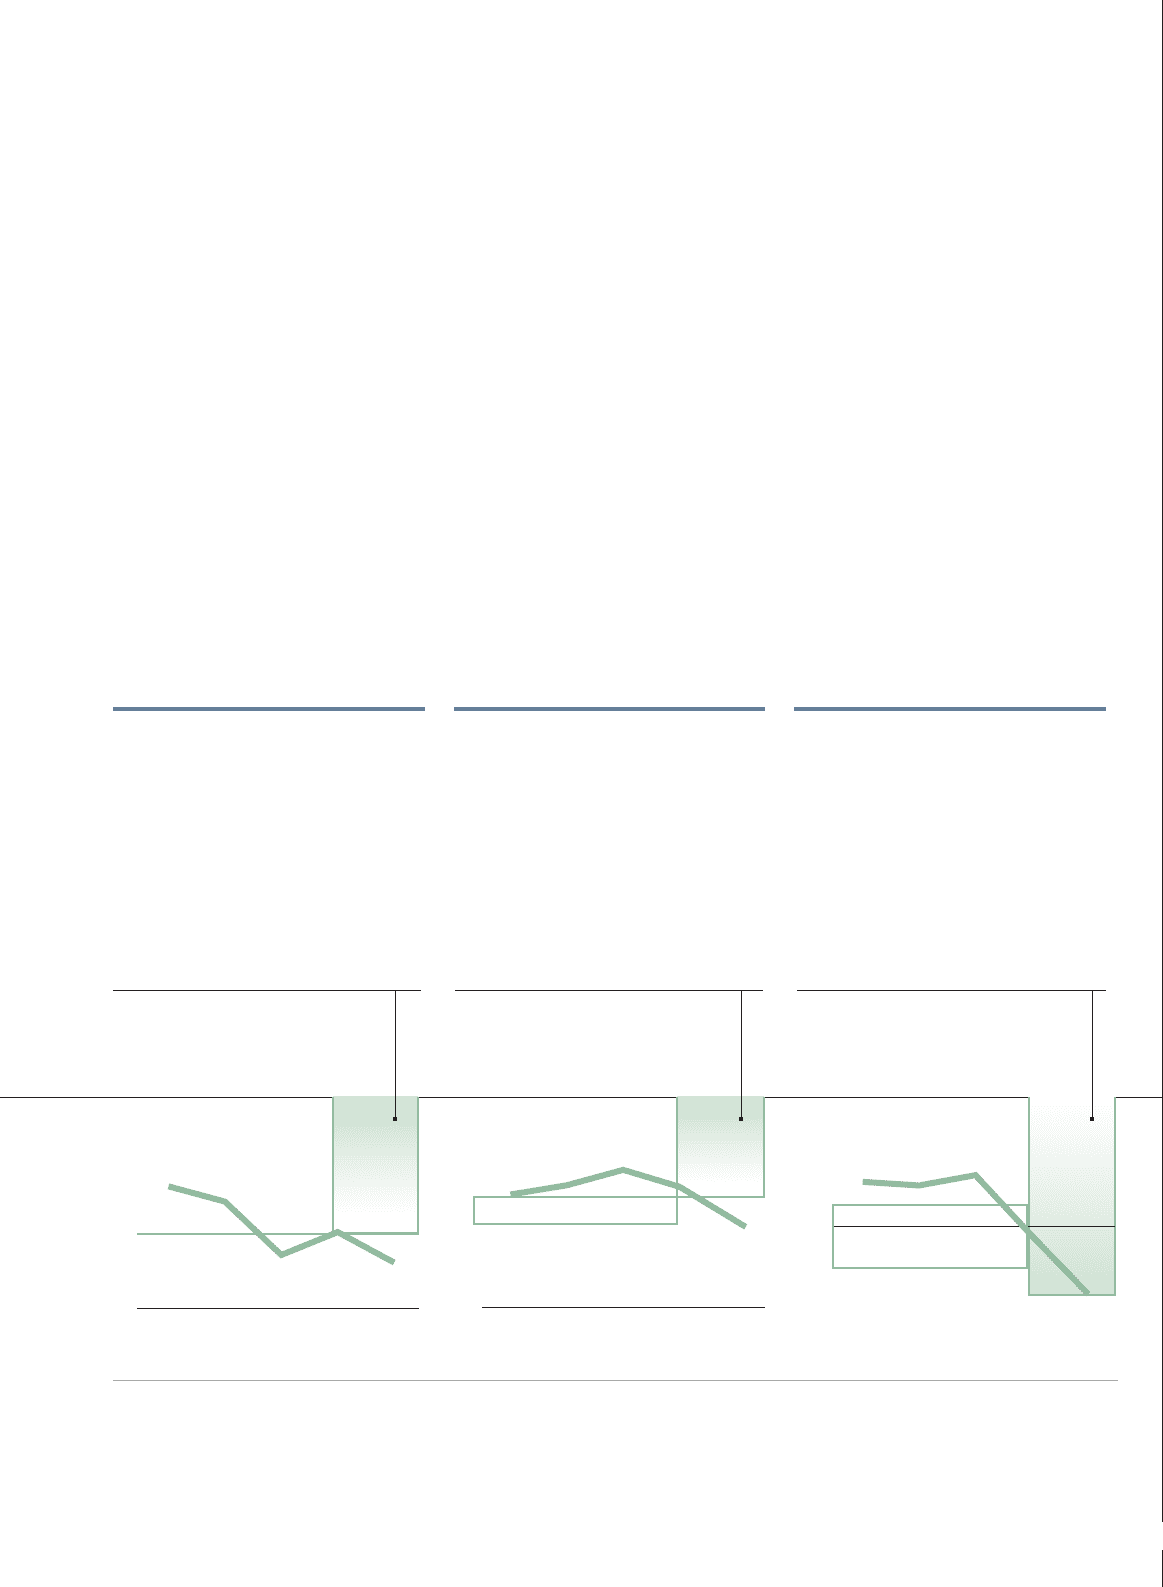
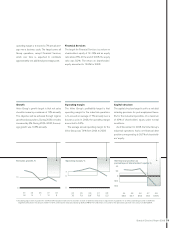
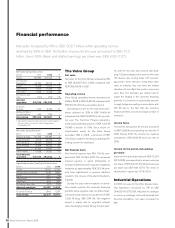
Growth
Volvo Group’s growth target is that net sales
should increase by a minimum of 10% annually.
This objective will be achieved through organic
growth and acquisitions. During 2008, net sales
increased by 6%. During 2004–2008, the aver-
age growth was 10.6% annually.
Operating margin
The Volvo Group’s profi tability target is that
operating margin for the industrial operations
is to exceed an average of 7% annually over a
business cycle. In 2008, the operating margin
amounted to 5.2%.
The average annual operating margin for the
Volvo Group was 7.4% from 2004 to 2008.
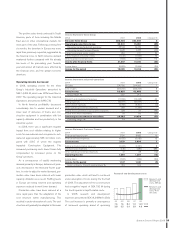
Capital structure
The capital structure target is set to a net debt
including provisions for post-employment bene-
fi ts for the industrial operations of a maximum
of 40% of shareholders’ equity under normal
conditions.
As of December 31, 2008, the Volvo Group's
industrial operations had a net fi nancial debt
position corresponding to 39.7% of sharehold-
ers’ equity.
Net sales growth, % Operating margin, % Net fi nancial position as
percentage of shareholders' equity, %
(5.7)
07
(39.7)
08
25.8
04
23.7
05
29.2
06
40
20
0
(20)
(40)
1) Excluding adjustment of goodwill in 2006. 2006 included a reversal of a valuation reserve for deferred taxes and an adjustment of goodwill. As an effect, operating income in 2006 was
negatively affected in the amount of SEK 1,712 M, while income taxes decreased by SEK 2,048 M. The total effect on income for the period was positive in an amount of SEK 336 M.
7.8
07
5.2
08
7.3
04
0
7
5
7.9
05 06
8.91
10
07
6
08
16
04
0
10
14
05
7
06
operating margin is to exceed a 7% annual aver-
age over a business cycle. The target covers all
Group operations, except Financial Services,
which over time is, expected to contribute
approximately one additional percentage point.
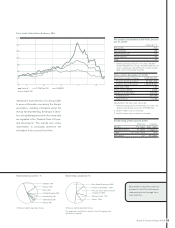
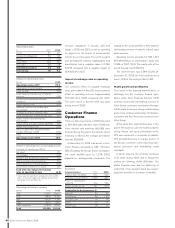
Financial Services
The target for Financial Services is a return on
shareholders’ equity of 12–15% and an equity
ratio above 8%. At the end of 2008, the equity
ratio was 8.2%. The return on shareholders'
equity amounted to 12.6% for 2008.
31
Board of Directors’ Report 2008