Volvo 2008 Annual Report Download - page 147
Download and view the complete annual report
Please find page 147 of the 2008 Volvo annual report below. You can navigate through the pages in the report by either clicking on the pages listed below, or by using the keyword search tool below to find specific information within the annual report.-
 1
1 -
2
-
3
-
4
-
5
-
6
-
7
-
8
-
9
-
10
-
11
-
12
-
13
-
14
-
15
-
16
-
17
-
18
-
19
-
20
-
21
-
22
-
23
-
24
-
25
-
26
-
27
-
28
-
29
-
30
-
31
-
32
-
33
-
34
-
35
-
36
-
37
-
38
-
39
-
40
-
41
-
42
-
43
-
44
-
45
-
46
-
47
-
48
-
49
-
50
-
51
-
52
-
53
-
54
-
55
-
56
-
57
-
58
-
59
-
60
-
61
-
62
-
63
-
64
-
65
-
66
-
67
-
68
-
69
-
70
-
71
-
72
-
73
-
74
-
75
-
76
-
77
-
78
-
79
-
80
-
81
-
82
-
83
-
84
-
85
-
86
-
87
-
88
-
89
-
90
-
91
-
92
-
93
-
94
-
95
-
96
-
97
-
98
-
99
-
100
-
101
-
102
-
103
-
104
-
105
-
106
-
107
-
108
-
109
-
110
-
111
-
112
-
113
-
114
-
115
-
116
-
117
-
118
-
119
-
120
-
121
-
122
-
123
-
124
-
125
-
126
-
127
-
128
-
129
-
130
-
131
-
132
-
133
-
134
-
135
-
136
-
 137
137 -
 138
138 -
 139
139 -
 140
140 -
 141
141 -
 142
142 -
 143
143 -
 144
144 -
 145
145 -
 146
146 -
 147
147 -
 148
148 -
 149
149 -
 150
150 -
 151
151 -
 152
152 -
 153
153 -
 154
154 -
 155
155 -
 156
156 -
 157
157 -
158
-
159
-
160
 |
 |

143
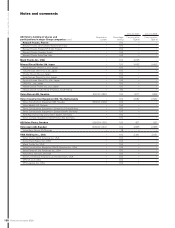
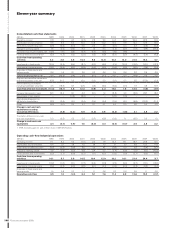
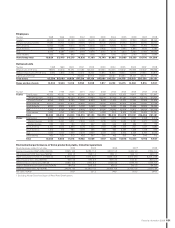
Financial information 2008
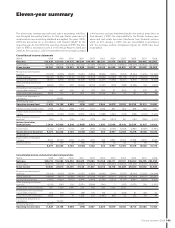
Eleven-year summary
The eleven-year summary presents each year in accordance with Gen-
eral Accepted Accounting Practice for that year. Earlier years are not
restated when new accounting standards are applied. The years 1998–
2003 are accounted for in accordance with Swedish GAAP for the
respective year. As from 2004 the reporting is based on IFRS. The tran-
sition to IFRS is described in note 3 in the Annual Reports 2005 and
2006. As from January 1, 2007, the benefi ts from the synergies created
in the business units are transferred back to the product areas. Also, as
from January 1, 2007, the responsibility for the Group’s treasury oper-
ations and real estate has been transferred from Financial services,
which, as from January 1, 2007, only are consolidated in accordance
with the purchase method. Comparison fi gures for 2006 have been
recalculated.
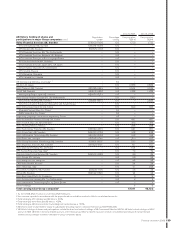
Consolidated income statements
SEK M 1998 1999 2000 2001 2002 2003 2004 2005 2006 2007 2008
Net sales 212,936 125,019 130,070 189,280 186,198 183,291 211,076 240,559 258,835 285,405 303,667
Cost of sales (163,876) (99,501) (104,548) (155,592) (151,569) (146,879) (164,170) (186,662) (199,054) (219,600) (237,578)
Gross income 49,060 25,518 25,522 33,688 34,629 36,412 46,906 53,897 59,781 65,805 66,089
Research and development
expenses (10,104) (4,525) (4,876) (5,391) (5,869) (6,829) (7,614) (7,557) (8,354) (11,059) (14,348)
Selling expenses (19,042) (8,865) (10,140) (15,766) (16,604) (16,866) (19,369) (20,778) (21,213) (26,068) (27,129)
Administrative expenses (8,091) (4,791) (4,974) (6,709) (5,658) (5,467) (5,483) (6,301) (6,551) (7,133) (6,940)
Other operating income and
expenses (2,634) (611) 622 (4,096) (4,152) (1,367) (618) (588) (3,466) 163 (1,915)
Income (loss) from investments
in associated companies 444 567 444 50 182 200 27 (557) 61 430 25
Income from other investments 4,526 170 70 1,410 309 (3,579) 830 37 141 93 69
Income from divestment of
subsidiaries – 26,695 –––––––––
Restructuring costs (2,331) ––(3,862) –––––––
Operating income (loss) 11,828 34,158 6,668 (676) 2,837 2,504 14,679 18,153 20,399 22,231 15,851
Interest income and similar credits 1,268 1,812 1,588 1,275 1,217 1,096 821 654 666 952 1,171
Interest expenses and similar
charges (1,315) (1,505) (1,845) (2,274) (1,840) (1,888) (1,254) (972) (585) (1,122) (1,935)
Other fi nancial income and
expenses (162) 131 (165) (191) (201) (55) (1,210) 181 (181) (504) (1,077)
Income (loss) after
fi nancial items 11,619 34,596 6,246 (1,866) 2,013 1,657 13,036 18,016 20,299 21,557 14,010
Income taxes (3,140) (2,270) (1,510) 326 (590) (1,334) (3,129) (4,908) (3,981) (6,529) (3,994)
Income (loss) for the period 8,479 32,326 4,736 (1,540) 1,423 323 9,907 13,108 16,318 15,028 10,016
Attributable to
Equity holders of the parent
company 8,437 32,222 4,709 (1,467) 1,393 298 9,867 13,054 16,268 14,932 9,942
Minority interest 42 104 27 (73) 30 25 40 54 50 96 74
8,479 32,326 4,736 (1,540) 1,423 323 9,907 13,108 16,318 15,028 10,016
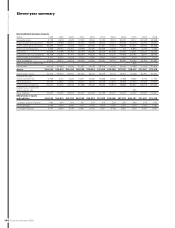
Consolidated income statements Industrial operations
SEK M 1998 1999 2000 2001 2002 2003 2004 2005 2006 2007 2008
Net sales 205,712 116,382 120,392 180,615 177,080 174,768 202,171 231,191 249,020 276,795 294,932
Cost of sales (158,077) (92,772) (97,131) (149,477) (145,453) (141,256) (158,453) (180,823) (192,400) (214,160) (232,247)
Gross income 47,635 23,610 23,261 31,138 31,627 33,512 43,718 50,368 56,620 62,635 62,685
Research and development
expenses (10,104) (4,525) (4,876) (5,391) (5,869) (6,829) (7,614) (7,557) (8,354) (11,059) (14,348)
Selling expenses (18,468) (8,117) (9,285) (14,663) (15,393) (15,891) (18,317) (19,616) (19,999) (24,671) (25,597)
Administrative expenses (7,950) (4,632) (4,651) (6,474) (5,464) (5,259) (5,310) (6,147) (6,481) (7,092) (6,921)
Other operating income and
expenses (2,515) (587) 309 (3,071) (2,989) (540) 7 (397) (3,275) 249 (1,457)
Income from Financial Services 681 1,066 1,499 325 490 926 1,365 2,033 –––
Income (loss) from investments
in associated companies 354 478 341 (86) 126 166 2 (568) 61 428 23
Income from other investments 4,526 170 70 1,408 309 (3,581) 828 37 141 93 69
Income from divestment of
subsidiaries – 26,695 –––––––––
Restructuring costs (2,331) ––(3,862) –––––––
Operating income (loss) 11,828 34,158 6,668 (676) 2,837 2,504 14,679 18,153 18,713 20,583 14,454