United Airlines 2014 Annual Report Download - page 98
Download and view the complete annual report
Please find page 98 of the 2014 United Airlines annual report below. You can navigate through the pages in the report by either clicking on the pages listed below, or by using the keyword search tool below to find specific information within the annual report.-
 1
1 -
2
-
3
-
4
-
5
-
6
-
7
-
8
-
9
-
10
-
11
-
12
-
13
-
14
-
15
-
16
-
17
-
18
-
19
-
20
-
21
-
22
-
23
-
24
-
25
-
26
-
27
-
28
-
29
-
30
-
31
-
32
-
33
-
34
-
35
-
36
-
37
-
38
-
39
-
40
-
41
-
42
-
43
-
44
-
45
-
46
-
47
-
48
-
49
-
50
-
51
-
52
-
53
-
54
-
55
-
56
-
57
-
58
-
59
-
60
-
61
-
62
-
63
-
64
-
65
-
66
-
67
-
68
-
69
-
70
-
71
-
72
-
73
-
74
-
75
-
76
-
77
-
78
-
79
-
80
-
81
-
82
-
83
-
84
-
85
-
86
-
87
-
 88
88 -
 89
89 -
 90
90 -
 91
91 -
 92
92 -
 93
93 -
 94
94 -
 95
95 -
 96
96 -
 97
97 -
 98
98 -
 99
99 -
 100
100 -
 101
101 -
 102
102 -
 103
103 -
 104
104 -
 105
105 -
 106
106 -
 107
107 -
 108
108 -
109
-
110
-
111
-
112
-
113
-
114
-
115
-
116
-
117
-
118
-
119
-
120
-
121
-
122
-
123
-
124
-
125
-
126
-
127
-
128
-
129
-
130
-
131
-
132
-
133
-
134
-
135
-
136
-
137
-
138
-
139
-
140
-
141
-
142
-
143
-
144
-
145
-
146
-
147
-
148
-
149
-
150
-
151
-
152
-
153
-
154
-
155
-
156
-
157
-
158
-
159
-
160
-
161
 |
 |

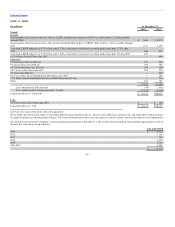
Table of Contents
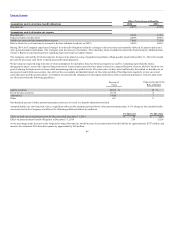
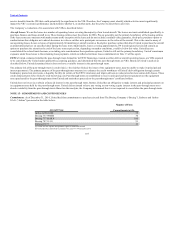
We have master trading agreements with all of our fuel hedging counterparties that allow us to net our fuel hedge derivative positions. We have elected not to
net the fair value positions and collateral recorded on our consolidated balance sheets. The following table shows the potential net fair value positions
(including fuel derivatives and related collateral) had we elected to offset. The table reflects offset at the counterparty level (in millions):
Receivables $ — $ 89
Other assets: Other, net — 15
Current liabilities: Other (209) —
Other liabilities and deferred credits: Other (30) —
Hedge derivatives assets (liabilities), net $ (239) $ 104
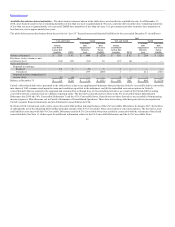
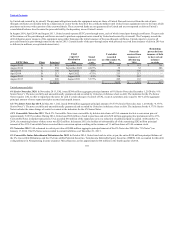
The following tables present the fuel hedge gains (losses) recognized during the periods presented and their classification in the financial statements (in
millions):
Fuel contracts $ (599) $ 39 $ (89) $ 18 $ (3) $ 5
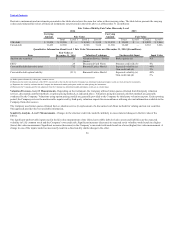
Fuel contracts $ (462) $ 79 $ 38
98