United Airlines 2014 Annual Report Download - page 71
Download and view the complete annual report
Please find page 71 of the 2014 United Airlines annual report below. You can navigate through the pages in the report by either clicking on the pages listed below, or by using the keyword search tool below to find specific information within the annual report.-
 1
1 -
2
-
3
-
4
-
5
-
6
-
7
-
8
-
9
-
10
-
11
-
12
-
13
-
14
-
15
-
16
-
17
-
18
-
19
-
20
-
21
-
22
-
23
-
24
-
25
-
26
-
27
-
28
-
29
-
30
-
31
-
32
-
33
-
34
-
35
-
36
-
37
-
38
-
39
-
40
-
41
-
42
-
43
-
44
-
45
-
46
-
47
-
48
-
49
-
50
-
51
-
52
-
53
-
54
-
55
-
56
-
57
-
58
-
59
-
60
-
 61
61 -
 62
62 -
 63
63 -
 64
64 -
 65
65 -
 66
66 -
 67
67 -
 68
68 -
 69
69 -
 70
70 -
 71
71 -
 72
72 -
 73
73 -
 74
74 -
 75
75 -
 76
76 -
 77
77 -
 78
78 -
 79
79 -
 80
80 -
 81
81 -
82
-
83
-
84
-
85
-
86
-
87
-
88
-
89
-
90
-
91
-
92
-
93
-
94
-
95
-
96
-
97
-
98
-
99
-
100
-
101
-
102
-
103
-
104
-
105
-
106
-
107
-
108
-
109
-
110
-
111
-
112
-
113
-
114
-
115
-
116
-
117
-
118
-
119
-
120
-
121
-
122
-
123
-
124
-
125
-
126
-
127
-
128
-
129
-
130
-
131
-
132
-
133
-
134
-
135
-
136
-
137
-
138
-
139
-
140
-
141
-
142
-
143
-
144
-
145
-
146
-
147
-
148
-
149
-
150
-
151
-
152
-
153
-
154
-
155
-
156
-
157
-
158
-
159
-
160
-
161
 |
 |

Table of Contents
of the United brand and access to MileagePlus member lists; advertising; baggage services; and airport lounge usage (together, excluding “the air
transportation element,” the “marketing-related deliverables”).
The fair value of the elements is determined using management’s estimated selling price of each element. The objective of using the estimated
selling price based methodology is to determine the price at which we would transact a sale if the product or service were sold on a stand-alone
basis. Accordingly, we determine our best estimate of selling price by considering multiple inputs and methods including, but not limited to,
discounted cash flows, brand value, volume discounts, published selling prices, number of miles awarded and number of miles redeemed. The
Company estimated the selling prices and volumes over the term of the Co-Brand Agreement in order to determine the allocation of proceeds to
each of the multiple elements to be delivered. The method for determining the selling price of the mile component changed March 30, 2014, as
described above. We also evaluate volumes on an annual basis, which may result in a change in the allocation of estimated selling price on a
prospective basis.
The Company records passenger revenue related to the air transportation element when the transportation is delivered. The other elements are
generally recognized as Other operating revenue when earned.
The Company accounts for miles sold and awarded that will never be redeemed by program members, which we refer to as breakage. The Company
reviews its breakage estimates annually based upon the latest available information regarding redemption and expiration patterns. Miles expire
after 18 months of member account inactivity.
The Company’s estimate of the expected expiration of miles requires significant management judgment. Current and future changes to expiration
assumptions or to the expiration policy, or to program rules and program redemption opportunities, may result in material changes to the deferred
revenue balance as well as recognized revenues from the programs.
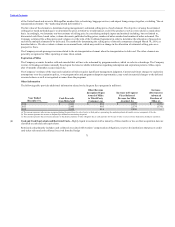
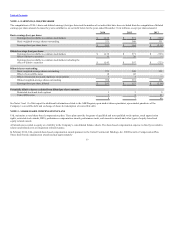
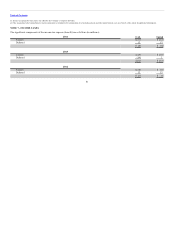
The following table provides additional information related to the frequent flyer program (in millions):
2014 $ 2,861 $ 882 $ 2,178 $ (199)
2013 2,903 903 2,174 (174)
2012 2,852 816 2,036 —
(a) This amount represents other revenue recognized during the period from the sale of miles to third parties, representing the marketing-related deliverable services component of the sale.
(b) This amount represents the increase to frequent flyer deferred revenue during the period.
(c) This amount represents the net increase (decrease) in the advance purchase of miles obligation due to cash payments for the sale of miles in excess of (less than) miles awarded to customers.
(d) Highly liquid investments with a maturity of three months or less on their acquisition date are
classified as cash and cash equivalents.
Restricted cash primarily includes cash collateral associated with workers’ compensation obligations, reserves for institutions that process credit
card ticket sales and cash collateral received from fuel hedge
71