United Airlines 2014 Annual Report Download - page 53
Download and view the complete annual report
Please find page 53 of the 2014 United Airlines annual report below. You can navigate through the pages in the report by either clicking on the pages listed below, or by using the keyword search tool below to find specific information within the annual report.-
 1
1 -
2
-
3
-
4
-
5
-
6
-
7
-
8
-
9
-
10
-
11
-
12
-
13
-
14
-
15
-
16
-
17
-
18
-
19
-
20
-
21
-
22
-
23
-
24
-
25
-
26
-
27
-
28
-
29
-
30
-
31
-
32
-
33
-
34
-
35
-
36
-
37
-
38
-
39
-
40
-
41
-
42
-
 43
43 -
 44
44 -
 45
45 -
 46
46 -
 47
47 -
 48
48 -
 49
49 -
 50
50 -
 51
51 -
 52
52 -
 53
53 -
 54
54 -
 55
55 -
 56
56 -
 57
57 -
 58
58 -
 59
59 -
 60
60 -
 61
61 -
 62
62 -
 63
63 -
64
-
65
-
66
-
67
-
68
-
69
-
70
-
71
-
72
-
73
-
74
-
75
-
76
-
77
-
78
-
79
-
80
-
81
-
82
-
83
-
84
-
85
-
86
-
87
-
88
-
89
-
90
-
91
-
92
-
93
-
94
-
95
-
96
-
97
-
98
-
99
-
100
-
101
-
102
-
103
-
104
-
105
-
106
-
107
-
108
-
109
-
110
-
111
-
112
-
113
-
114
-
115
-
116
-
117
-
118
-
119
-
120
-
121
-
122
-
123
-
124
-
125
-
126
-
127
-
128
-
129
-
130
-
131
-
132
-
133
-
134
-
135
-
136
-
137
-
138
-
139
-
140
-
141
-
142
-
143
-
144
-
145
-
146
-
147
-
148
-
149
-
150
-
151
-
152
-
153
-
154
-
155
-
156
-
157
-
158
-
159
-
160
-
161
 |
 |

Table of Contents
The Company may adjust its hedging program based on changes in market conditions. The following table summarizes information related to the Company’s
cost of fuel and hedging (in millions, except percentages):
In 2014, fuel cost as a percent of total operating expenses (a) 32%
Impact of $1 increase in price per barrel of aircraft fuel on annual fuel expense (b) $ 93
Liability fair value at December 31, 2014 (c) $717
Increase in fuel hedge liability that would result from a concurrent 10% decrease in forward prices of the underlying commodities of fuel
hedges (d) $138
Collateral deposited with fuel hedge counterparties as of December 31, 2014 $577
Additional collateral the Company would be required to deposit with fuel hedge counterparties upon a concurrent 10% decrease in forward
prices of the underlying commodities of fuel hedges (e) $ 53
(a) Includes related taxes and excludes hedging impacts and special charges. In 2013, the Company’s fuel cost was 34% of total operating expenses.
(b) Based on 2015 projected fuel consumption. Does not include the impact of fuel hedges.
(c) As of December 31, 2013, the net fair value of the Company’s fuel hedges was an asset of $104 million.
(d) Based on fuel hedge positions at December 31, 2014.
(e) Assumes instantaneous change in prices and includes margin related to some hedge positions beyond December 31, 2015; approximately 1% for 2016.
As of December 31, 2014, the Company had hedged approximately 22% and 1% of its projected fuel requirements (859 million and 35 million gallons,
respectively) for 2015 and 2016, respectively, with commonly used financial hedge instruments based on aircraft fuel or crude oil. As of December 31, 2014,
the Company had fuel hedges expiring through March 2016.
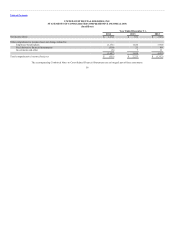
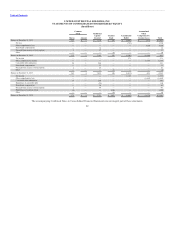
The fuel hedge portfolio is comprised of many individual hedge contracts (primarily option contracts) on multiple underlying commodities and entered into
at various points in time, resulting in a wide range of strike prices with several hedge counterparties. The table below provides a view of the economic impact
of the hedge portfolio on the Company’s 2015 fuel costs given significant moves (up to +/-30%) in market fuel prices from December 31, 2014 (in millions).
30% (0.53) (0.07) (0.61)
20% (0.36) (0.11) (0.47)
10% (0.18) (0.15) (0.33)
(10)% 0.18 (0.22) (0.04)
(20)% 0.36 (0.25) 0.10
(30)% 0.53 (0.29) 0.24
(a) Projected using equal shifts in spot and forward prices for aircraft fuel and crude oil underlying hedge contracts from December 31, 2014 levels.
(b) Projections based on estimated consumption of 3.9 billion gallons and a price of $1.78 per gallon, excluding taxes and other delivery costs.
(c) Cash gain/(loss), including premiums, on existing hedges as of December 31, 2014. Includes all hedges whether or not the hedges are designated for hedge accounting.
53