United Airlines 2014 Annual Report Download - page 29
Download and view the complete annual report
Please find page 29 of the 2014 United Airlines annual report below. You can navigate through the pages in the report by either clicking on the pages listed below, or by using the keyword search tool below to find specific information within the annual report.-
 1
1 -
2
-
3
-
4
-
5
-
6
-
7
-
8
-
9
-
10
-
11
-
12
-
13
-
14
-
15
-
16
-
17
-
18
-
 19
19 -
 20
20 -
 21
21 -
 22
22 -
 23
23 -
 24
24 -
 25
25 -
 26
26 -
 27
27 -
 28
28 -
 29
29 -
 30
30 -
 31
31 -
 32
32 -
 33
33 -
 34
34 -
 35
35 -
 36
36 -
 37
37 -
 38
38 -
 39
39 -
40
-
41
-
42
-
43
-
44
-
45
-
46
-
47
-
48
-
49
-
50
-
51
-
52
-
53
-
54
-
55
-
56
-
57
-
58
-
59
-
60
-
61
-
62
-
63
-
64
-
65
-
66
-
67
-
68
-
69
-
70
-
71
-
72
-
73
-
74
-
75
-
76
-
77
-
78
-
79
-
80
-
81
-
82
-
83
-
84
-
85
-
86
-
87
-
88
-
89
-
90
-
91
-
92
-
93
-
94
-
95
-
96
-
97
-
98
-
99
-
100
-
101
-
102
-
103
-
104
-
105
-
106
-
107
-
108
-
109
-
110
-
111
-
112
-
113
-
114
-
115
-
116
-
117
-
118
-
119
-
120
-
121
-
122
-
123
-
124
-
125
-
126
-
127
-
128
-
129
-
130
-
131
-
132
-
133
-
134
-
135
-
136
-
137
-
138
-
139
-
140
-
141
-
142
-
143
-
144
-
145
-
146
-
147
-
148
-
149
-
150
-
151
-
152
-
153
-
154
-
155
-
156
-
157
-
158
-
159
-
160
-
161
 |
 |
Table of Contents
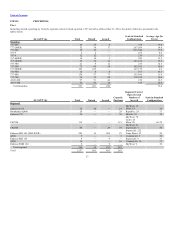
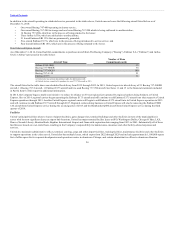
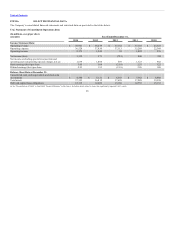
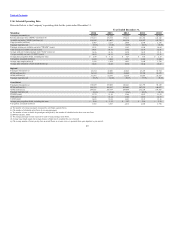
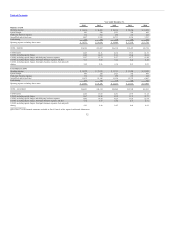
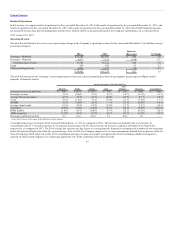
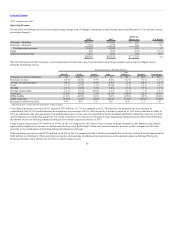
Presented below is the Company’s operating data for the years ended December 31.
Passengers (thousands) (a) 91,475 91,329 93,595 96,360 65,365
Revenue passenger miles (“RPMs”) (millions) (b) 179,015 178,578 179,416 181,763 122,182
Available seat miles (“ASMs”) (millions) (c) 214,105 213,007 216,330 219,437 145,738
Cargo ton miles (millions) 2,487 2,213 2,460 2,646 2,176
Passenger load factor (d) 83.6% 83.8% 82.9% 82.8% 83.8%
Passenger revenue per available seat mile (“PRASM”) (cents) 12.51 12.20 11.93 11.84 10.99
Total revenue per available seat mile (cents) 14.81 14.51 13.92 13.77 12.91
Average yield per revenue passenger mile (“Yield”) (cents) (e) 14.96 14.56 14.38 14.29 13.11
Cost per available seat mile (“CASM”) (cents) 14.03 14.31 14.12 13.15 12.51
Average price per gallon of fuel, including fuel taxes $ 2.98 $ 3.12 $ 3.27 $ 3.01 $ 2.27
Fuel gallons consumed (millions) 3,183 3,204 3,275 3,303 2,280
Average stage length (miles) (f) 1,958 1,934 1,895 1,844 1,789
Average daily utilization of each aircraft (hours) (g) 10:26 10:28 10:38 10:42 10:47
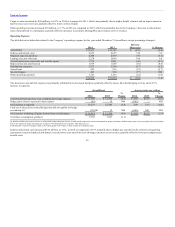
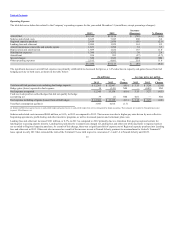
Passengers (thousands) (a) 46,554 47,880 46,846 45,439 32,764
RPMs (millions) (b) 26,544 26,589 26,069 25,768 18,675
ASMs (millions) (c) 31,916 32,347 32,530 33,091 23,827
Passenger load factor (d) 83.2% 82.2% 80.1% 77.9% 78.4%
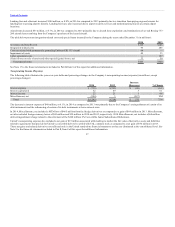
Passengers (thousands) (a) 138,029 139,209 140,441 141,799 98,129
RPMs (millions) (b) 205,559 205,167 205,485 207,531 140,857
ASMs (millions) (c) 246,021 245,354 248,860 252,528 169,565
Passenger load factor (d) 83.6% 83.6% 82.6% 82.2% 83.1%
PRASM (cents) 13.72 13.50 13.09 12.87 11.93
Yield (cents) (e) 16.42 16.14 15.86 15.67 14.37
CASM (cents) 14.85 15.09 14.91 13.97 13.18
Average price per gallon of fuel, including fuel taxes $ 2.99 $ 3.13 $ 3.27 $ 3.06 $ 2.39
Fuel gallons consumed (millions) 3,905 3,947 4,016 4,038 2,798
(a) The number of revenue passengers measured by each flight segment flown.
(b) The number of scheduled miles flown by revenue passengers.
(c) The number of seats available for passengers multiplied by the number of scheduled miles those seats are flown.
(d) RPM divided by ASM.
(e) The average passenger revenue received for each revenue passenger mile flown.
(f) Average stage length equals the average distance a flight travels weighted for size of aircraft.
(g) The average number of hours per day that an aircraft flown in revenue service is operated (from gate departure to gate arrival).
29