United Airlines 2014 Annual Report Download - page 40
Download and view the complete annual report
Please find page 40 of the 2014 United Airlines annual report below. You can navigate through the pages in the report by either clicking on the pages listed below, or by using the keyword search tool below to find specific information within the annual report.-
 1
1 -
2
-
3
-
4
-
5
-
6
-
7
-
8
-
9
-
10
-
11
-
12
-
13
-
14
-
15
-
16
-
17
-
18
-
19
-
20
-
21
-
22
-
23
-
24
-
25
-
26
-
27
-
28
-
29
-
 30
30 -
 31
31 -
 32
32 -
 33
33 -
 34
34 -
 35
35 -
 36
36 -
 37
37 -
 38
38 -
 39
39 -
 40
40 -
 41
41 -
 42
42 -
 43
43 -
 44
44 -
 45
45 -
 46
46 -
 47
47 -
 48
48 -
 49
49 -
 50
50 -
51
-
52
-
53
-
54
-
55
-
56
-
57
-
58
-
59
-
60
-
61
-
62
-
63
-
64
-
65
-
66
-
67
-
68
-
69
-
70
-
71
-
72
-
73
-
74
-
75
-
76
-
77
-
78
-
79
-
80
-
81
-
82
-
83
-
84
-
85
-
86
-
87
-
88
-
89
-
90
-
91
-
92
-
93
-
94
-
95
-
96
-
97
-
98
-
99
-
100
-
101
-
102
-
103
-
104
-
105
-
106
-
107
-
108
-
109
-
110
-
111
-
112
-
113
-
114
-
115
-
116
-
117
-
118
-
119
-
120
-
121
-
122
-
123
-
124
-
125
-
126
-
127
-
128
-
129
-
130
-
131
-
132
-
133
-
134
-
135
-
136
-
137
-
138
-
139
-
140
-
141
-
142
-
143
-
144
-
145
-
146
-
147
-
148
-
149
-
150
-
151
-
152
-
153
-
154
-
155
-
156
-
157
-
158
-
159
-
160
-
161
 |
 |

Table of Contents
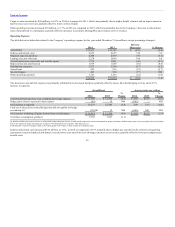
Aircraft maintenance materials and outside repairs increased $61 million, or 3.5%, in 2013 as compared to 2012 primarily due to increased volume and scope
of airframe heavy checks, mainly on the Boeing 747 and Boeing 757 fleet types, partially offset by a reduction in engine maintenance volumes driven
mainly by the timing of overhauls.
Depreciation and amortization increased $167 million, or 11.0%, in 2013 as compared to 2012 due to additions in owned property and equipment in the
current year, specifically related to new aircraft and improvements at airport facilities, as well as accelerated depreciation of $89 million on 30 Boeing 757-
200 aircraft in process of being sold to a third party.
Other operating expenses increased $514 million, or 11.0%, in 2013 as compared to 2012 due to the cost of aircraft fuel sold to a third party and an increase
in other personnel-related expenses.
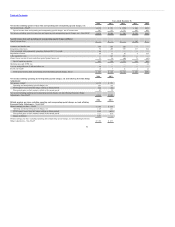
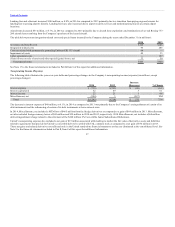
The table below presents integration-related costs and special items incurred by UAL during the years ended December 31 (in millions):
Severance and benefit costs $105 $ 125
Integration-related costs 205 739
Impairment of assets held for disposal 33 30
Labor agreement costs 127 475
(Gains) losses on sale of assets and other special (gains) losses, net 50 (46)
Total special items $520 $1,323
See Note 17 to the financial statements included in Part II, Item 8 of this report for additional information.
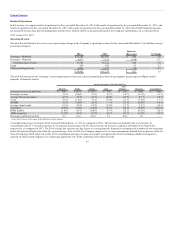
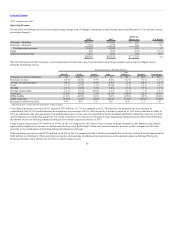
Nonoperating Income (Expense)
The following table illustrates the year-over-year dollar and percentage changes in UAL’s nonoperating income (expense) (in millions, except percentage
changes):
Interest expense $(783) $(835) $ (52) (6.2)
Interest capitalized 49 37 12 32.4
Interest income 21 23 (2) (8.7)
Miscellaneous, net 3 12 (9) (75.0)
Total $(710) $(763) $ (53) (6.9)
The decrease in interest expense of $52 million, or 6.2%, in 2013 as compared to 2012 was primarily due to lower average debt principal outstanding for a
majority of the year.
In 2013, miscellaneous, net included a gain of $84 million from fuel hedge derivatives as compared to a gain of $37 million in 2012.
United’s nonoperating expense also included a net gain of $70 million associated with marking to market the fair value of derivative assets and liabilities
related to agreements that provide for United’s convertible debt to be settled with UAL common stock as compared to a net gain of $42 million in 2012. This
net gain and related derivatives were reflected only in the United stand-alone financial statements as they were eliminated at the consolidated level. See Note
9 to the financial statements included in Part II, Item 8 of this report for additional information.
40