United Airlines 2014 Annual Report Download - page 114
Download and view the complete annual report
Please find page 114 of the 2014 United Airlines annual report below. You can navigate through the pages in the report by either clicking on the pages listed below, or by using the keyword search tool below to find specific information within the annual report.-
 1
1 -
2
-
3
-
4
-
5
-
6
-
7
-
8
-
9
-
10
-
11
-
12
-
13
-
14
-
15
-
16
-
17
-
18
-
19
-
20
-
21
-
22
-
23
-
24
-
25
-
26
-
27
-
28
-
29
-
30
-
31
-
32
-
33
-
34
-
35
-
36
-
37
-
38
-
39
-
40
-
41
-
42
-
43
-
44
-
45
-
46
-
47
-
48
-
49
-
50
-
51
-
52
-
53
-
54
-
55
-
56
-
57
-
58
-
59
-
60
-
61
-
62
-
63
-
64
-
65
-
66
-
67
-
68
-
69
-
70
-
71
-
72
-
73
-
74
-
75
-
76
-
77
-
78
-
79
-
80
-
81
-
82
-
83
-
84
-
85
-
86
-
87
-
88
-
89
-
90
-
91
-
92
-
93
-
94
-
95
-
96
-
97
-
98
-
99
-
100
-
101
-
102
-
103
-
 104
104 -
 105
105 -
 106
106 -
 107
107 -
 108
108 -
 109
109 -
 110
110 -
 111
111 -
 112
112 -
 113
113 -
 114
114 -
 115
115 -
 116
116 -
 117
117 -
 118
118 -
 119
119 -
 120
120 -
 121
121 -
 122
122 -
 123
123 -
 124
124 -
125
-
126
-
127
-
128
-
129
-
130
-
131
-
132
-
133
-
134
-
135
-
136
-
137
-
138
-
139
-
140
-
141
-
142
-
143
-
144
-
145
-
146
-
147
-
148
-
149
-
150
-
151
-
152
-
153
-
154
-
155
-
156
-
157
-
158
-
159
-
160
-
161
 |
 |

Table of Contents
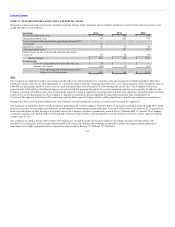
Operating segments are defined as components of an enterprise with separate financial information, which are evaluated regularly by the chief operating
decision maker and are used in resource allocation and performance assessments.
The Company deploys its aircraft across its route network through a single route scheduling system to maximize its value. When making resource allocation
decisions, the Company’s chief operating decision maker evaluates flight profitability data, which considers aircraft type and route economics. The
Company’s chief operating decision maker makes resource allocation decisions to maximize the Company’s consolidated financial results. Managing the
Company as one segment allows management the opportunity to maximize the value of its route network.
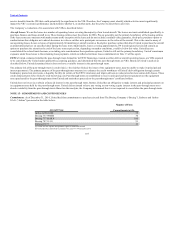
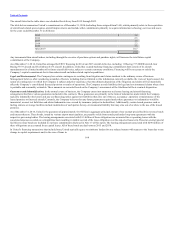
The Company’s operating revenue by principal geographic region (as defined by the U.S. Department of Transportation) for the years ended December 31 is
presented in the table below (in millions):
Domestic (U.S. and Canada) $ 22,320 $ 22,320
Pacific 5,767 5,767
Atlantic 7,321 7,321
Latin America 3,493 3,493
Total $ 38,901 $ 38,901
Domestic (U.S. and Canada) $ 22,092 $ 22,100
Pacific 5,794 5,794
Atlantic 7,132 7,132
Latin America 3,261 3,261
Total $ 38,279 $ 38,287
Domestic (U.S. and Canada) $ 21,276 $ 21,284
Pacific 6,040 6,040
Atlantic 6,582 6,582
Latin America 3,254 3,254
Total $ 37,152 $ 37,160
The Company attributes revenue among the geographic areas based upon the origin and destination of each flight segment. The Company’s operations
involve an insignificant level of dedicated revenue-producing assets in geographic regions as the overwhelming majority of the Company’s revenue
producing assets (primarily U.S. registered aircraft) can be deployed in any of its geographic regions.
114