United Airlines 2014 Annual Report Download - page 78
Download and view the complete annual report
Please find page 78 of the 2014 United Airlines annual report below. You can navigate through the pages in the report by either clicking on the pages listed below, or by using the keyword search tool below to find specific information within the annual report.-
 1
1 -
2
-
3
-
4
-
5
-
6
-
7
-
8
-
9
-
10
-
11
-
12
-
13
-
14
-
15
-
16
-
17
-
18
-
19
-
20
-
21
-
22
-
23
-
24
-
25
-
26
-
27
-
28
-
29
-
30
-
31
-
32
-
33
-
34
-
35
-
36
-
37
-
38
-
39
-
40
-
41
-
42
-
43
-
44
-
45
-
46
-
47
-
48
-
49
-
50
-
51
-
52
-
53
-
54
-
55
-
56
-
57
-
58
-
59
-
60
-
61
-
62
-
63
-
64
-
65
-
66
-
67
-
 68
68 -
 69
69 -
 70
70 -
 71
71 -
 72
72 -
 73
73 -
 74
74 -
 75
75 -
 76
76 -
 77
77 -
 78
78 -
 79
79 -
 80
80 -
 81
81 -
 82
82 -
 83
83 -
 84
84 -
 85
85 -
 86
86 -
 87
87 -
 88
88 -
89
-
90
-
91
-
92
-
93
-
94
-
95
-
96
-
97
-
98
-
99
-
100
-
101
-
102
-
103
-
104
-
105
-
106
-
107
-
108
-
109
-
110
-
111
-
112
-
113
-
114
-
115
-
116
-
117
-
118
-
119
-
120
-
121
-
122
-
123
-
124
-
125
-
126
-
127
-
128
-
129
-
130
-
131
-
132
-
133
-
134
-
135
-
136
-
137
-
138
-
139
-
140
-
141
-
142
-
143
-
144
-
145
-
146
-
147
-
148
-
149
-
150
-
151
-
152
-
153
-
154
-
155
-
156
-
157
-
158
-
159
-
160
-
161
 |
 |

Table of Contents
0.3 million shares of restricted stock and 0.5 million of RSUs that vest pro-rata over three years on the anniversary of the grant date. The time vested RSUs are
cash-settled based on the 20-day average closing price of UAL common stock immediately prior to the vesting date. In addition, UAL granted 0.6 million
RSUs that will vest based on UAL’s return on invested capital for the three years ending December 31, 2016. If this performance condition is achieved, cash
payments will be made after the end of the performance period based on the 20-day average closing price of UAL common stock immediately prior to the
vesting date (subject to a maximum payment valued at two times the closing stock price on the grant date). The Company accounts for the RSUs as liability
awards.
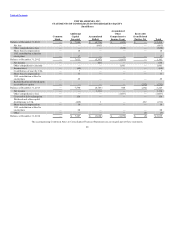
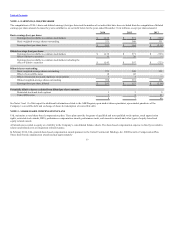
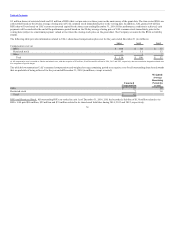
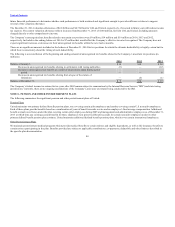
The following table provides information related to UAL’s share-based compensation plan cost for the years ended December 31 (in millions):
Compensation cost: (a)
RSUs $ 104 $ 88 $ 37
Restricted stock 10 11 13
Other — 1 7
Total $ 114 $ 100 $ 57
(a) All compensation cost is recorded to Salaries and related costs, with the exception of $3 million, $9 million and $9 million in 2014, 2013 and 2012, respectively, that was recorded in integration-related costs
as a component of special charges.
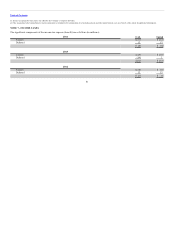
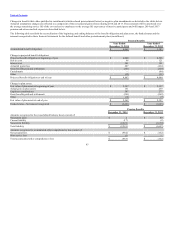
The table below summarizes UAL’s unearned compensation and weighted-average remaining period to recognize costs for all outstanding share-based awards
that are probable of being achieved for the year ended December 31, 2014 (in millions, except as noted):
RSUs $ 55 1.4
Restricted stock 7 1.4
Total $ 62
RSUs and Restricted Stock. All outstanding RSUs are settled in cash. As of December 31, 2014, UAL had recorded a liability of $136 million related to its
RSUs. UAL paid $86 million, $29 million and $35 million related to its share-based liabilities during 2014, 2013 and 2012, respectively.
78