United Airlines 2014 Annual Report Download - page 83
Download and view the complete annual report
Please find page 83 of the 2014 United Airlines annual report below. You can navigate through the pages in the report by either clicking on the pages listed below, or by using the keyword search tool below to find specific information within the annual report.-
 1
1 -
2
-
3
-
4
-
5
-
6
-
7
-
8
-
9
-
10
-
11
-
12
-
13
-
14
-
15
-
16
-
17
-
18
-
19
-
20
-
21
-
22
-
23
-
24
-
25
-
26
-
27
-
28
-
29
-
30
-
31
-
32
-
33
-
34
-
35
-
36
-
37
-
38
-
39
-
40
-
41
-
42
-
43
-
44
-
45
-
46
-
47
-
48
-
49
-
50
-
51
-
52
-
53
-
54
-
55
-
56
-
57
-
58
-
59
-
60
-
61
-
62
-
63
-
64
-
65
-
66
-
67
-
68
-
69
-
70
-
71
-
72
-
 73
73 -
 74
74 -
 75
75 -
 76
76 -
 77
77 -
 78
78 -
 79
79 -
 80
80 -
 81
81 -
 82
82 -
 83
83 -
 84
84 -
 85
85 -
 86
86 -
 87
87 -
 88
88 -
 89
89 -
 90
90 -
 91
91 -
 92
92 -
 93
93 -
94
-
95
-
96
-
97
-
98
-
99
-
100
-
101
-
102
-
103
-
104
-
105
-
106
-
107
-
108
-
109
-
110
-
111
-
112
-
113
-
114
-
115
-
116
-
117
-
118
-
119
-
120
-
121
-
122
-
123
-
124
-
125
-
126
-
127
-
128
-
129
-
130
-
131
-
132
-
133
-
134
-
135
-
136
-
137
-
138
-
139
-
140
-
141
-
142
-
143
-
144
-
145
-
146
-
147
-
148
-
149
-
150
-
151
-
152
-
153
-
154
-
155
-
156
-
157
-
158
-
159
-
160
-
161
 |
 |

Table of Contents
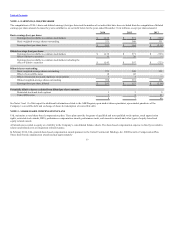
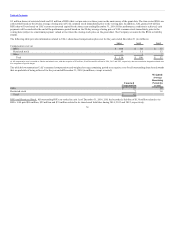
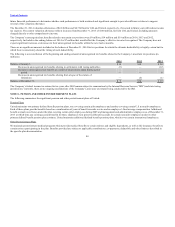
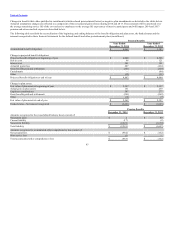
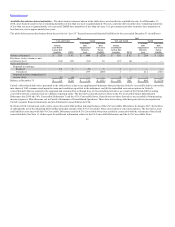
Temporary differences and carryforwards that give rise to deferred tax assets and liabilities at December 31, 2014 and 2013 were as follows (in millions):
Deferred income tax asset (liability):
Federal and state net operating loss (“NOL”) carryforwards $ 3,491 $ 4,006 $ 3,423 $ 3,943
Frequent flyer deferred revenue 2,287 2,254 2,287 2,254
Employee benefits, including pension, postretirement and medical 1,943 1,701 1,943 1,701
Alternative minimum tax credit carryforwards 214 233 214 233
Other 657 340 659 340
Less: Valuation allowance (4,751) (4,591) (4,721) (4,561)
Total deferred tax assets $ 3,841 $ 3,943 $ 3,805 $ 3,910
Depreciation, capitalized interest and other $ (3,212) $ (3,201) $ (3,212) $ (3,201)
Intangibles (1,545) (1,585) (1,545) (1,585)
Other (84) (144) (48) (111)
Total deferred tax liabilities $ (4,841) $ (4,930) $ (4,805) $ (4,897)
Net deferred tax liability $ (1,000) $ (987) $ (1,000) $ (987)
United and its domestic consolidated subsidiaries file a consolidated federal income tax return with UAL. Under an intercompany tax allocation policy,
United and its subsidiaries compute, record and pay UAL for their own tax liability as if they were separate companies filing separate returns. In determining
their own tax liabilities, United and each of its subsidiaries take into account all tax credits or benefits generated and utilized as separate companies and they
are each compensated for the aforementioned tax benefits only if they would be able to use those benefits on a separate company basis.
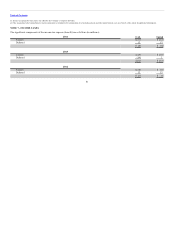
The federal and state NOL carryforwards relate to prior years’ NOLs, which may be used to reduce tax liabilities in future years. These tax benefits are mostly
attributable to federal pre-tax NOL carryforwards of $9.6 billion for UAL. If not utilized these federal pre-tax NOLs will expire as follows (in billions): $1.1 in
2024, $2.5 in 2025, $2.0 in 2026 and $4.0 after 2026. In addition, the majority of tax benefits of the state net operating losses of $111 million for UAL will
expire over a five to 20-year period.
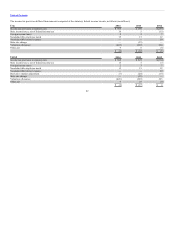
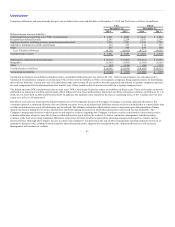
Our effective tax rates are lower than the federal statutory rate of 35% primarily because of the impact of changes to existing valuation allowances. We
continue to provide a valuation allowance for our deferred tax assets in excess of deferred tax liabilities because we have concluded that it is more likely than
not that such deferred tax assets will ultimately not be realized. The ultimate realization of deferred tax assets is dependent upon the generation of future
taxable income (including the reversals of deferred tax liabilities) during the periods in which those deferred tax assets will become deductible. The
Company’s management assesses available positive and negative evidence regarding the Company’s ability to realize its deferred tax assets and records a
valuation allowance when it is more likely than not that deferred tax assets will not be realized. To form a conclusion, management considers positive
evidence in the form of reversing temporary differences, projections of future taxable income and tax planning strategies and negative evidence such as
historical losses. Although the Company was not in a three-year cumulative loss position at the end of 2014, management determined that the low level of
cumulative pretax income, combined with uncertainty about forecasted results, supports the conclusion that the valuation allowance is still necessary.
Management will continue to evaluate
83