United Airlines 2014 Annual Report Download - page 36
Download and view the complete annual report
Please find page 36 of the 2014 United Airlines annual report below. You can navigate through the pages in the report by either clicking on the pages listed below, or by using the keyword search tool below to find specific information within the annual report.-
 1
1 -
2
-
3
-
4
-
5
-
6
-
7
-
8
-
9
-
10
-
11
-
12
-
13
-
14
-
15
-
16
-
17
-
18
-
19
-
20
-
21
-
22
-
23
-
24
-
25
-
 26
26 -
 27
27 -
 28
28 -
 29
29 -
 30
30 -
 31
31 -
 32
32 -
 33
33 -
 34
34 -
 35
35 -
 36
36 -
 37
37 -
 38
38 -
 39
39 -
 40
40 -
 41
41 -
 42
42 -
 43
43 -
 44
44 -
 45
45 -
 46
46 -
47
-
48
-
49
-
50
-
51
-
52
-
53
-
54
-
55
-
56
-
57
-
58
-
59
-
60
-
61
-
62
-
63
-
64
-
65
-
66
-
67
-
68
-
69
-
70
-
71
-
72
-
73
-
74
-
75
-
76
-
77
-
78
-
79
-
80
-
81
-
82
-
83
-
84
-
85
-
86
-
87
-
88
-
89
-
90
-
91
-
92
-
93
-
94
-
95
-
96
-
97
-
98
-
99
-
100
-
101
-
102
-
103
-
104
-
105
-
106
-
107
-
108
-
109
-
110
-
111
-
112
-
113
-
114
-
115
-
116
-
117
-
118
-
119
-
120
-
121
-
122
-
123
-
124
-
125
-
126
-
127
-
128
-
129
-
130
-
131
-
132
-
133
-
134
-
135
-
136
-
137
-
138
-
139
-
140
-
141
-
142
-
143
-
144
-
145
-
146
-
147
-
148
-
149
-
150
-
151
-
152
-
153
-
154
-
155
-
156
-
157
-
158
-
159
-
160
-
161
 |
 |

Table of Contents
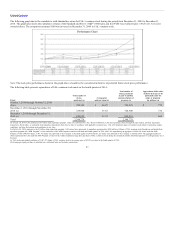
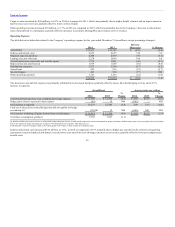
Cargo revenue increased by $56 million, or 6.3%, in 2014 as compared to 2013, which was primarily due to higher freight volumes and an improvement in
mail revenue year-over-year, partially offset by lower yield on freight.
Other operating revenue decreased $74 million, or 1.7%, in 2014 as compared to 2013, which was primarily due to the Company’s decision to discontinue
sales of aircraft fuel to a third party, partially offset by increases in ancillary, MileagePlus and contract services revenue.
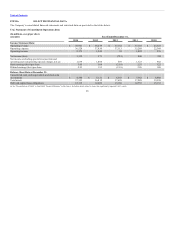
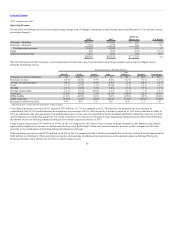
Operating Expense
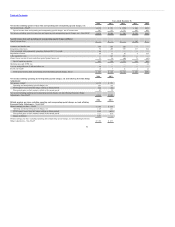
The table below includes data related to the Company’s operating expense for the year ended December 31 (in millions, except percentage changes):
Aircraft fuel $11,675 $12,345 $ (670) (5.4)
Salaries and related costs 8,935 8,625 310 3.6
Regional capacity purchase 2,344 2,419 (75) (3.1)
Landing fees and other rent 2,274 2,090 184 8.8
Aircraft maintenance materials and outside repairs 1,779 1,821 (42) (2.3)
Depreciation and amortization 1,679 1,689 (10) (0.6)
Distribution expenses 1,373 1,390 (17) (1.2)
Aircraft rent 883 936 (53) (5.7)
Special charges 443 520 (77) NM
Other operating expenses 5,143 5,195 (52) (1.0)
$36,528 $37,030 $ (502) (1.4)
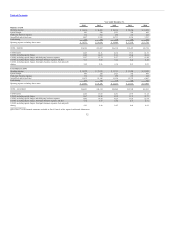
The decrease in aircraft fuel expense was primarily attributable to decreased fuel prices partially offset by losses from fuel hedging activity and a 0.3%
increase in capacity.
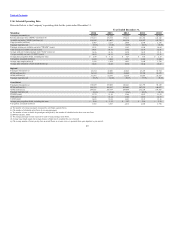
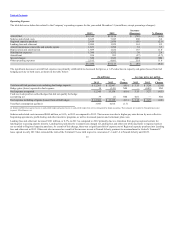
Total aircraft fuel purchase cost excluding fuel hedge impacts $ 11,586 $ 12,363 (6.3) $ 2.97 $3.13 (5.1)
Hedge gains (losses) reported in fuel expense (89) 18 NM (0.02) — NM
Fuel expense as reported 11,675 12,345 (5.4) 2.99 3.13 (4.5)
Cash received (paid) on settled hedges that did not qualify for hedge
accounting (a) (138)(b) 39 NM (0.04) 0.01 NM
Fuel expense including all gains (losses) from settled hedges $ 11,813 $ 12,306 (4.0) $ 3.03 $3.12 (2.9)
Total fuel consumption (gallons) 3,905 3,947 (1.1)
(a) Includes ineffectiveness gains (losses) on cash-settled hedges and gains (losses) on cash-settled hedges that were not designated for hedge accounting. Ineffectiveness gains (losses) and gains (losses) on hedges
that do not qualify for hedge accounting are recorded in Nonoperating income (expense): Miscellaneous, net.
(b) Includes $81 million for hedges settled in the fourth quarter of 2014 prior to their original 2015 maturity dates.
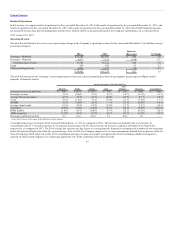
Salaries and related costs increased $310 million, or 3.6%, in 2014 as compared to 2013 primarily due to higher pay rates driven by collective bargaining
agreements, increased medical and dental costs and costs associated with crew shortages and new crew rest rules, partially offset by lower post-employment
benefit costs.
36