United Airlines 2014 Annual Report Download - page 33
Download and view the complete annual report
Please find page 33 of the 2014 United Airlines annual report below. You can navigate through the pages in the report by either clicking on the pages listed below, or by using the keyword search tool below to find specific information within the annual report.-
 1
1 -
2
-
3
-
4
-
5
-
6
-
7
-
8
-
9
-
10
-
11
-
12
-
13
-
14
-
15
-
16
-
17
-
18
-
19
-
20
-
21
-
22
-
 23
23 -
 24
24 -
 25
25 -
 26
26 -
 27
27 -
 28
28 -
 29
29 -
 30
30 -
 31
31 -
 32
32 -
 33
33 -
 34
34 -
 35
35 -
 36
36 -
 37
37 -
 38
38 -
 39
39 -
 40
40 -
 41
41 -
 42
42 -
 43
43 -
44
-
45
-
46
-
47
-
48
-
49
-
50
-
51
-
52
-
53
-
54
-
55
-
56
-
57
-
58
-
59
-
60
-
61
-
62
-
63
-
64
-
65
-
66
-
67
-
68
-
69
-
70
-
71
-
72
-
73
-
74
-
75
-
76
-
77
-
78
-
79
-
80
-
81
-
82
-
83
-
84
-
85
-
86
-
87
-
88
-
89
-
90
-
91
-
92
-
93
-
94
-
95
-
96
-
97
-
98
-
99
-
100
-
101
-
102
-
103
-
104
-
105
-
106
-
107
-
108
-
109
-
110
-
111
-
112
-
113
-
114
-
115
-
116
-
117
-
118
-
119
-
120
-
121
-
122
-
123
-
124
-
125
-
126
-
127
-
128
-
129
-
130
-
131
-
132
-
133
-
134
-
135
-
136
-
137
-
138
-
139
-
140
-
141
-
142
-
143
-
144
-
145
-
146
-
147
-
148
-
149
-
150
-
151
-
152
-
153
-
154
-
155
-
156
-
157
-
158
-
159
-
160
-
161
 |
 |

Table of Contents
United Continental Holdings, Inc. (together with its consolidated subsidiaries, “UAL” or the “Company”) is a holding company and its principal, wholly-
owned subsidiary is United Airlines, Inc. (together with its consolidated subsidiaries, “United”). As UAL consolidates United for financial statement
purposes, disclosures that relate to activities of United also apply to UAL, unless otherwise noted. United’s operating revenues and operating expenses
comprise nearly 100% of UAL’s revenues and operating expenses. In addition, United comprises approximately the entire balance of UAL’s assets, liabilities
and operating cash flows. When appropriate, UAL and United are named specifically for their individual contractual obligations and related disclosures and
any significant differences between the operations and results of UAL and United are separately disclosed and explained. We sometimes use the words “we,”
“our,” “us,” and the “Company” in this report for disclosures that relate to all of UAL and United.
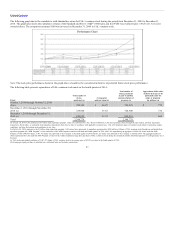
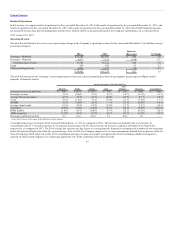
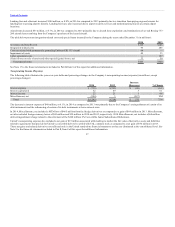
• 2014 net income was $1.1 billion, or $2.93 diluted earnings per share. The Company recorded Non-GAAP net income of $1.97 billion for 2014, or
$5.06 diluted earnings per share, which excludes $507 million of operating and nonoperating special charges and $327 million of Economic
Hedge Adjustments, consisting of $244 million of mark-to-market losses recorded in Nonoperating expense from fuel hedges settling in future
periods and $83 million of prior period gains recorded in Nonoperating expense on fuel contracts settled in the current period. See Part II, Item 6 of
this report for a reconciliation of GAAP to Non-GAAP net income.
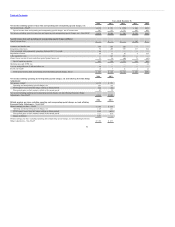
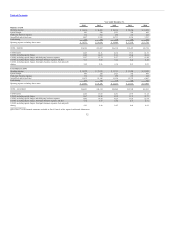
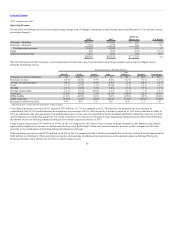
• United’s consolidated PRASM increased 1.6% for 2014 compared to 2013.
• 2014 consolidated CASM, excluding special charges, third-party business expenses, fuel and profit sharing, increased 1.3% year-over-year on a
consolidated capacity increase of 0.3%. 2014 CASM, including those items, decreased 1.6% year-over-year.
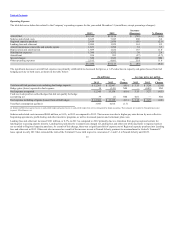
• In 2014, UAL returned approximately $320 million to shareholders as part of its previously announced $1 billion share repurchase program. In
addition, throughout the year, United spent $310 million to retire convertible debt that was convertible into approximately 5.8 million shares of
UAL common stock.
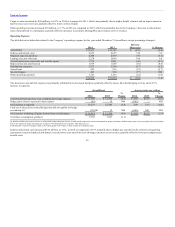
• UAL ended the year with $5.7 billion in unrestricted liquidity, which consisted of unrestricted cash, cash equivalents, short-term investments and
available capacity under the revolving credit facility of the Company’s Credit Agreement.
• Consolidated RPMs for 2014 increased 0.2% as compared to 2013, and consolidated ASMs increased 0.3% from the prior year, resulting in a
consolidated load factor of 83.6% in 2014, which is the same load factor as in 2013.
• The Company took delivery of four new Boeing 787-8 and two new Boeing 787-9 Dreamliners in 2014, bringing its total Dreamliner fleet to 14
aircraft. The Company also took delivery of 29 new Boeing 737-900ERs and 19 new Embraer E175s in 2014. United exited from scheduled
service 37 Boeing 757-200s.
Set forth below is a discussion of the principal matters that we believe could impact our financial and operating performance and cause our results of
operations in future periods to differ materially from our historical operating results and/or from our anticipated results of operations described in the forward-
looking statements in this report. See Item 1A., Risk Factors, of this report and the factors described under “Forward-Looking Information” below for
additional discussion of these and other factors that could affect us.
33