United Airlines 2014 Annual Report Download - page 116
Download and view the complete annual report
Please find page 116 of the 2014 United Airlines annual report below. You can navigate through the pages in the report by either clicking on the pages listed below, or by using the keyword search tool below to find specific information within the annual report.-
 1
1 -
2
-
3
-
4
-
5
-
6
-
7
-
8
-
9
-
10
-
11
-
12
-
13
-
14
-
15
-
16
-
17
-
18
-
19
-
20
-
21
-
22
-
23
-
24
-
25
-
26
-
27
-
28
-
29
-
30
-
31
-
32
-
33
-
34
-
35
-
36
-
37
-
38
-
39
-
40
-
41
-
42
-
43
-
44
-
45
-
46
-
47
-
48
-
49
-
50
-
51
-
52
-
53
-
54
-
55
-
56
-
57
-
58
-
59
-
60
-
61
-
62
-
63
-
64
-
65
-
66
-
67
-
68
-
69
-
70
-
71
-
72
-
73
-
74
-
75
-
76
-
77
-
78
-
79
-
80
-
81
-
82
-
83
-
84
-
85
-
86
-
87
-
88
-
89
-
90
-
91
-
92
-
93
-
94
-
95
-
96
-
97
-
98
-
99
-
100
-
101
-
102
-
103
-
104
-
105
-
 106
106 -
 107
107 -
 108
108 -
 109
109 -
 110
110 -
 111
111 -
 112
112 -
 113
113 -
 114
114 -
 115
115 -
 116
116 -
 117
117 -
 118
118 -
 119
119 -
 120
120 -
 121
121 -
 122
122 -
 123
123 -
 124
124 -
 125
125 -
 126
126 -
127
-
128
-
129
-
130
-
131
-
132
-
133
-
134
-
135
-
136
-
137
-
138
-
139
-
140
-
141
-
142
-
143
-
144
-
145
-
146
-
147
-
148
-
149
-
150
-
151
-
152
-
153
-
154
-
155
-
156
-
157
-
158
-
159
-
160
-
161
 |
 |

Table of Contents
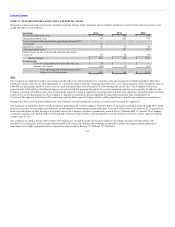
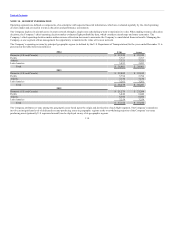
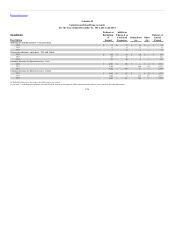
UAL’s quarterly financial data is subject to seasonal fluctuations and historically its second and third quarter financial results, which reflect higher travel
demand, are better than its first and fourth quarter financial results. UAL’s quarterly results were impacted by the following significant items (in millions):
Operating:
Severance and benefit costs $ 14 $ 38 $ 6 $ 141
Integration-related costs 34 17 28 17
Costs associated with permanently grounding Embraer ERJ 135 aircraft — 66 — —
Impairment of assets 1 32 — 16
Losses on sale of assets and other special (gains) losses, net 3 16 9 5
Special charges 52 169 43 179
Nonoperating:
Loss on extinguishment of debt and other, net 21 — — 53
Income tax benefit (1) — (3) (6)
Total operating and nonoperating special charges, net of income taxes $ 72 $ 169 $ 40 $ 226
Special charges (income):
Severance and benefit costs $ 14 $ — $ — $ 91
Integration-related costs 70 45 50 40
Labor agreement costs — — 127 —
Impairment of assets — — — 33
(Gains) losses on sale of assets and other special (gains) losses, net 8 7 34 1
Total special items 92 52 211 165
Income tax benefit — — — (7)
Total special items, net of tax $ 92 $ 52 $ 211 $ 158
See Note 17 of this report for additional information of these items.
None.
116