United Airlines 2014 Annual Report Download - page 35
Download and view the complete annual report
Please find page 35 of the 2014 United Airlines annual report below. You can navigate through the pages in the report by either clicking on the pages listed below, or by using the keyword search tool below to find specific information within the annual report.-
 1
1 -
2
-
3
-
4
-
5
-
6
-
7
-
8
-
9
-
10
-
11
-
12
-
13
-
14
-
15
-
16
-
17
-
18
-
19
-
20
-
21
-
22
-
23
-
24
-
 25
25 -
 26
26 -
 27
27 -
 28
28 -
 29
29 -
 30
30 -
 31
31 -
 32
32 -
 33
33 -
 34
34 -
 35
35 -
 36
36 -
 37
37 -
 38
38 -
 39
39 -
 40
40 -
 41
41 -
 42
42 -
 43
43 -
 44
44 -
 45
45 -
46
-
47
-
48
-
49
-
50
-
51
-
52
-
53
-
54
-
55
-
56
-
57
-
58
-
59
-
60
-
61
-
62
-
63
-
64
-
65
-
66
-
67
-
68
-
69
-
70
-
71
-
72
-
73
-
74
-
75
-
76
-
77
-
78
-
79
-
80
-
81
-
82
-
83
-
84
-
85
-
86
-
87
-
88
-
89
-
90
-
91
-
92
-
93
-
94
-
95
-
96
-
97
-
98
-
99
-
100
-
101
-
102
-
103
-
104
-
105
-
106
-
107
-
108
-
109
-
110
-
111
-
112
-
113
-
114
-
115
-
116
-
117
-
118
-
119
-
120
-
121
-
122
-
123
-
124
-
125
-
126
-
127
-
128
-
129
-
130
-
131
-
132
-
133
-
134
-
135
-
136
-
137
-
138
-
139
-
140
-
141
-
142
-
143
-
144
-
145
-
146
-
147
-
148
-
149
-
150
-
151
-
152
-
153
-
154
-
155
-
156
-
157
-
158
-
159
-
160
-
161
 |
 |

Table of Contents
In this section, we compare results of operations for the year ended December 31, 2014 with results of operations for the year ended December 31, 2013, and
results of operations for the year ended December 31, 2013 with results of operations for the year ended December 31, 2012. Non-GAAP financial measures
are presented because they provide management and investors with the ability to measure and monitor the Company’s performance on a consistent basis.
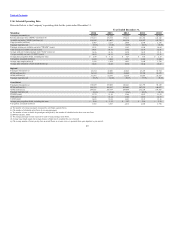
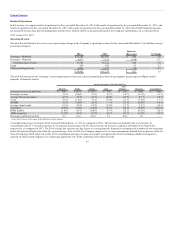
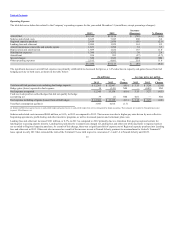
Operating Revenue
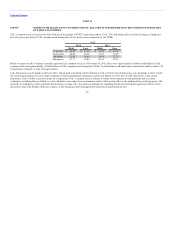
The table below illustrates the year-over-year percentage change in the Company’s operating revenues for the years ended December 31 (in millions, except
percentage changes):
Passenger—Mainline $26,785 $25,997 $ 788 3.0
Passenger—Regional 6,977 7,125 (148) (2.1)
Total passenger revenue 33,762 33,122 640 1.9
Cargo 938 882 56 6.3
Other operating revenue 4,201 4,275 (74) (1.7)
$ 38,901 $ 38,279 $ 622 1.6
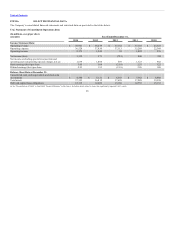
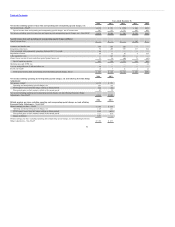
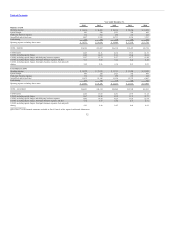
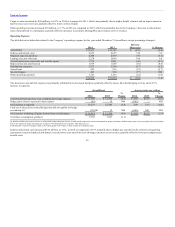
The table below presents the Company’s selected passenger revenue and selected operating data based on geographic region (regional flights consist
primarily of domestic routes):
Passenger revenue (in millions) $ 490 $ (41) $ 169 $ 170 $ 788 $ (148) $ 640
Passenger revenue 3.9 % (0.9)% 2.9 % 6.5 % 3.0 % (2.1)% 1.9 %
Average fare per passenger 4.7 % 2.2 % 4.1 % (4.2)% 2.9 % 0.7 % 2.8 %
Yield 4.9 % (1.6)% 3.6 % (1.9)% 2.7 % (1.9)% 1.7 %
PRASM 5.2 % (3.6)% 2.6 % — % 2.5 % (0.8)% 1.6 %
Average stage length 0.5 % 4.8 % 0.9 % (1.8)% 1.2 % 3.5 % 2.4 %
Passengers (0.8)% (3.0)% (1.2)% 11.2 % 0.2 % (2.8)% (0.8) %
RPMs (traffic) (1.0)% 0.8 % (0.8)% 8.5 % 0.2 % (0.2)% 0.2 %
ASMs (capacity) (1.3)% 2.8 % 0.3 % 6.5 % 0.5 % (1.3)% 0.3 %
Passenger load factor (points) 0.3 (1.6) (0.8) 1.5 (0.2) 1.0 —
(a) See Part II, Item 6 of this report for the definition of these statistics.
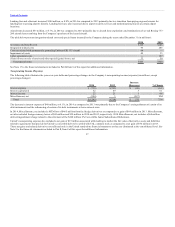
Consolidated passenger revenue in 2014 increased $640 million, or 1.9%, as compared to 2013. This increase was primarily due to an increase in
consolidated yield of 1.7% and an increase in average fare per passenger of 2.8%. There was also an increase in capacity and traffic of 0.3%and 0.2%,
respectively, as compared to 2013. The 2014 average fare increase was due in part to a strong domestic demand environment and a number of new long-haul
routes that generated higher fares than the system average. Also in 2014, the Company improved its revenue management demand forecast process related to
close-in bookings which improved yields. 2013 consolidated passenger revenue was negatively impacted by factors including additional competitive
capacity in China and the Japanese yen weakening against the U.S. dollar, resulting in lower Pacific yields.
35