United Airlines 2014 Annual Report Download - page 31
Download and view the complete annual report
Please find page 31 of the 2014 United Airlines annual report below. You can navigate through the pages in the report by either clicking on the pages listed below, or by using the keyword search tool below to find specific information within the annual report.-
 1
1 -
2
-
3
-
4
-
5
-
6
-
7
-
8
-
9
-
10
-
11
-
12
-
13
-
14
-
15
-
16
-
17
-
18
-
19
-
20
-
 21
21 -
 22
22 -
 23
23 -
 24
24 -
 25
25 -
 26
26 -
 27
27 -
 28
28 -
 29
29 -
 30
30 -
 31
31 -
 32
32 -
 33
33 -
 34
34 -
 35
35 -
 36
36 -
 37
37 -
 38
38 -
 39
39 -
 40
40 -
 41
41 -
42
-
43
-
44
-
45
-
46
-
47
-
48
-
49
-
50
-
51
-
52
-
53
-
54
-
55
-
56
-
57
-
58
-
59
-
60
-
61
-
62
-
63
-
64
-
65
-
66
-
67
-
68
-
69
-
70
-
71
-
72
-
73
-
74
-
75
-
76
-
77
-
78
-
79
-
80
-
81
-
82
-
83
-
84
-
85
-
86
-
87
-
88
-
89
-
90
-
91
-
92
-
93
-
94
-
95
-
96
-
97
-
98
-
99
-
100
-
101
-
102
-
103
-
104
-
105
-
106
-
107
-
108
-
109
-
110
-
111
-
112
-
113
-
114
-
115
-
116
-
117
-
118
-
119
-
120
-
121
-
122
-
123
-
124
-
125
-
126
-
127
-
128
-
129
-
130
-
131
-
132
-
133
-
134
-
135
-
136
-
137
-
138
-
139
-
140
-
141
-
142
-
143
-
144
-
145
-
146
-
147
-
148
-
149
-
150
-
151
-
152
-
153
-
154
-
155
-
156
-
157
-
158
-
159
-
160
-
161
 |
 |

Table of Contents
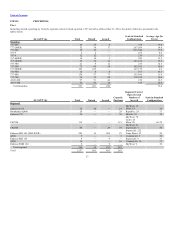
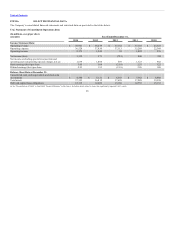
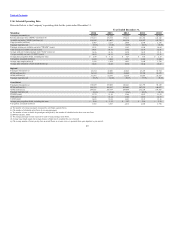
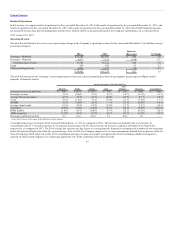
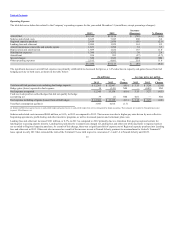
Net income (loss)—GAAP $1,132 $ 571 $ (723) $ 840 $253
Special revenue item and operating and nonoperating special charges, net of income taxes 507 513 1,312 483 689
Net income excluding special revenue item and operating and nonoperating special charges, net—Non-GAAP $1,639 $1,084 $ 589 $1,323 $942
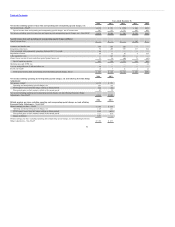
Special revenue item $ — $ — $ — $ 107 $ —
Severance and benefit costs 199 105 125 — —
Integration-related costs 96 205 739 517 564
Costs associated with permanently grounding Embraer ERJ 135 aircraft 66 — — — —
Impairment of assets 49 33 30 4 165
Labor agreement costs — 127 475 — —
(Gains) losses on sale of assets and other special (gains) losses, net 33 50 (46) 71 (60)
Special operating expense 443 520 1,323 592 669
Operating non-cash MTM loss — — — — 32
Loss on extinguishment of debt and other, net 74 — — — —
Income tax benefit 10 7 11 2 12
Total special revenue item and operating and nonoperating special charges, net (a) $ 507 $ 513 $1,312 $ 483 $689
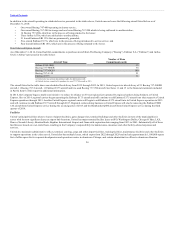
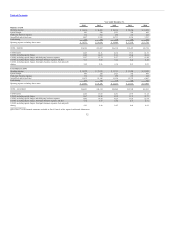
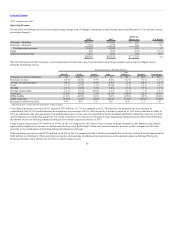
Net income—GAAP $1,132 $ 571
Operating and nonoperating special charges, net 507 513
MTM (gains) losses from fuel hedges settling in future periods 244 (84)
Prior period gains on fuel contracts settled in the current period 83 39
Net income excluding operating and nonoperating special charges, net and reflecting Economic Hedge
Adjustments—Non-GAAP $1,966 $1,039
Diluted earnings per share—GAAP $ 2.93 $ 1.53
Operating and nonoperating special charges, net 1.29 1.31
MTM (gains) losses from fuel hedges settling in future periods 0.62 (0.21)
Prior period gains on fuel contracts settled in the current period 0.21 0.10
Impact of dilution 0.01 —
Diluted earnings per share excluding operating and nonoperating special charges, net and reflecting Economic
Hedge Adjustments—Non-GAAP $ 5.06 $ 2.73
31